Fig. 8
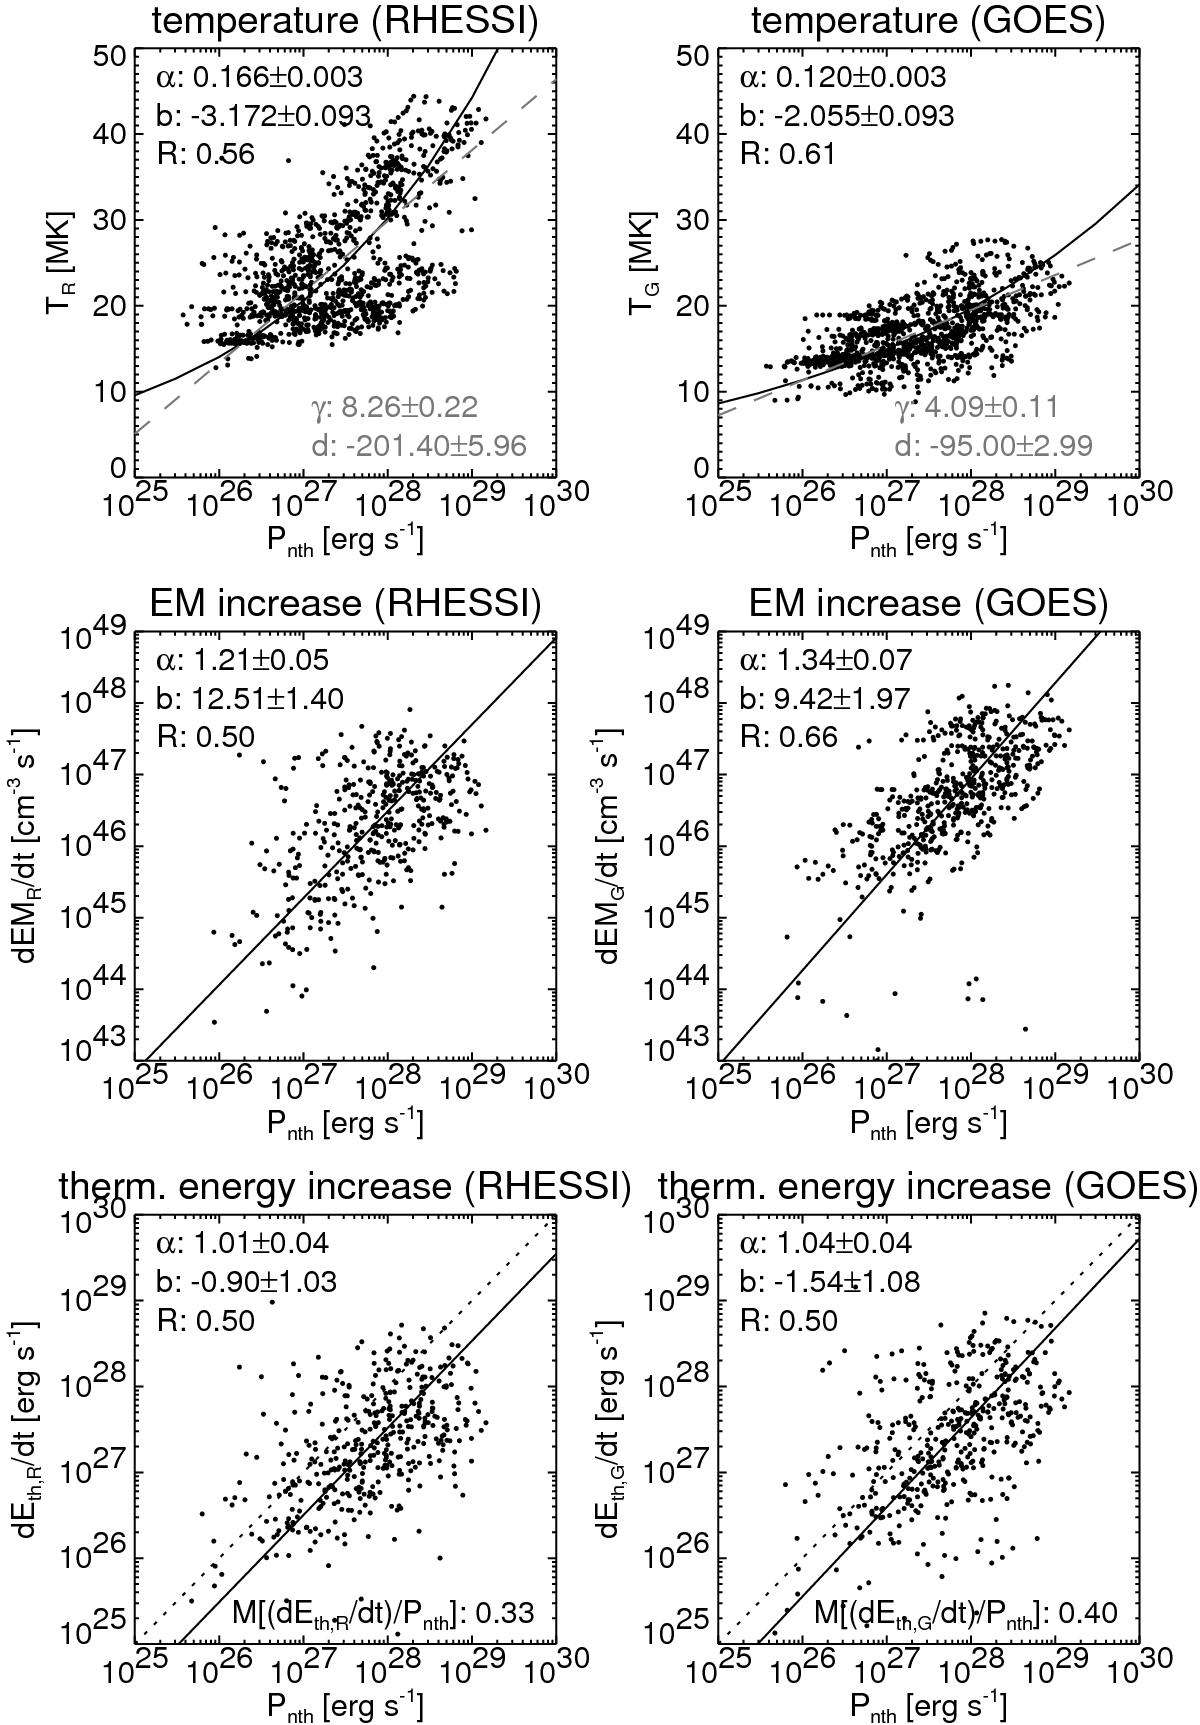
Thermal flare parameters plotted versus cotemporal energy input rate by nonthermal electrons, Pnth. Shown are temperatures T (top), emission measure increase rates dEM/ dt (middle), and thermal energy increase rate dEth/ dt (bottom), derived from RHESSI (left column) and GOES data (right column). Also shown are power-law fits (full lines), the slope and intercept of the obtained power law, α and b, and the rank correlation coefficient, R. For T, an exponential fit (dashed gray line) is also shown together with the fit parameters γ and d. For dEth/ dt, the dotted line denotes x = y, and the median ratio M of the thermal energy increase and the nonthermal input is indicated.
Current usage metrics show cumulative count of Article Views (full-text article views including HTML views, PDF and ePub downloads, according to the available data) and Abstracts Views on Vision4Press platform.
Data correspond to usage on the plateform after 2015. The current usage metrics is available 48-96 hours after online publication and is updated daily on week days.
Initial download of the metrics may take a while.