Fig. 7
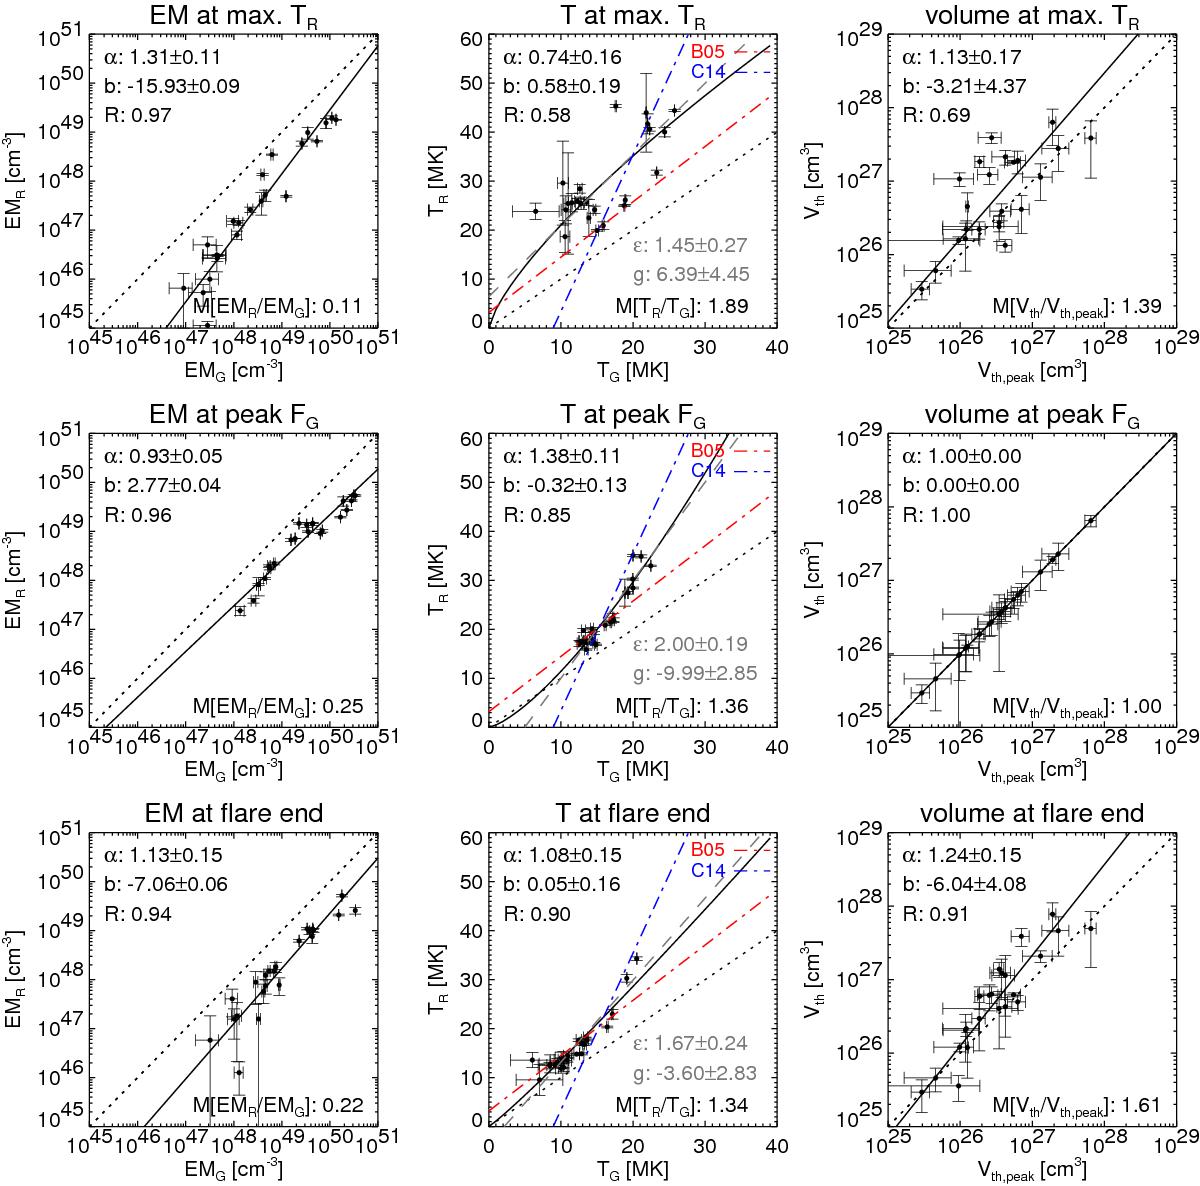
As in Fig. 5, but showing the relation between thermal parameters derived from cotemporal RHESSI and GOES data for three different evolutionary stages of the flares. Compared are the emission measures (left column) and temperatures (middle column). Additionally, the corresponding thermal volumes are compared to the volume at the GOES SXR flux peak, Vth,peak (right column). The three evolutionary stages correspond to the times of the maximum RHESSI temperature (top row), the SXR peak (middle row), and the latest analyzed time interval (t = tend; bottom row). RHESSI gives lower emission measures and higher temperatures than GOES in the early flare phase, when the thermal volumes are comparatively large.
Current usage metrics show cumulative count of Article Views (full-text article views including HTML views, PDF and ePub downloads, according to the available data) and Abstracts Views on Vision4Press platform.
Data correspond to usage on the plateform after 2015. The current usage metrics is available 48-96 hours after online publication and is updated daily on week days.
Initial download of the metrics may take a while.