Fig. 5
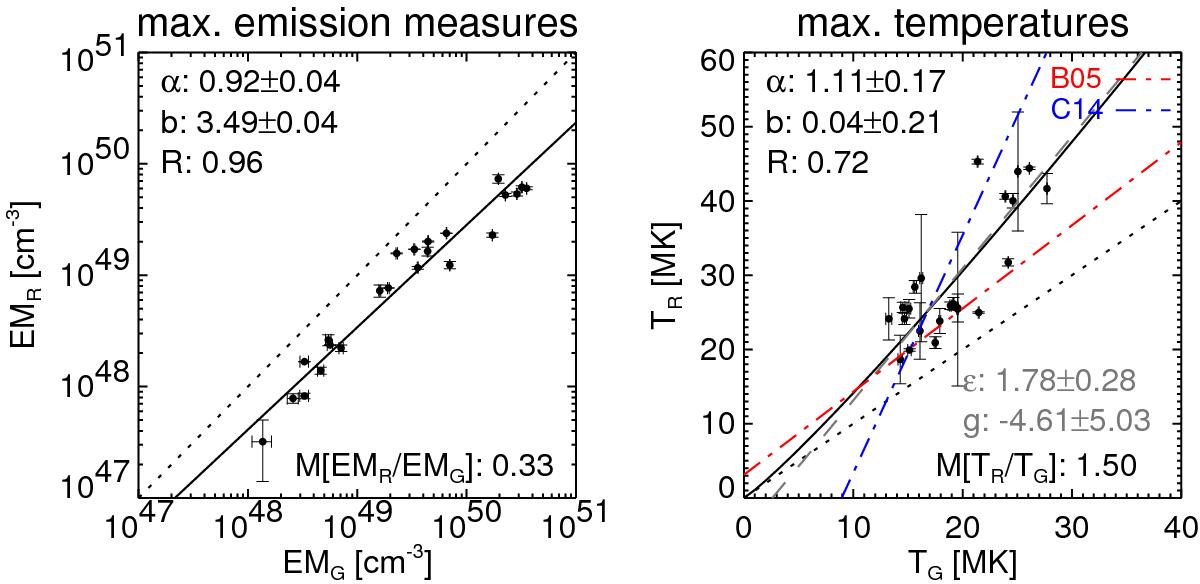
Comparison of maximum thermal parameters derived from RHESSI to parameters as given by GOES. Shown are the maximum emission measures EM (left) and temperatures T (right). We also show power-law fits (full lines), the slope and intercept of the obtained power law, α and b, and the rank correlation coefficient, R. For the temperatures, a linear fit (dashed gray line, with slope ϵ and intercept g) is also shown. The dotted black line denotes x = y. At the bottom of the plots, the median ratio (M [ .../... ]) of the parameters derived from RHESSI and GOES is shown. The temperature correlations found by Battaglia et al. (2005) and Caspi et al. (2014a) are indicated by dash-dotted lines.
Current usage metrics show cumulative count of Article Views (full-text article views including HTML views, PDF and ePub downloads, according to the available data) and Abstracts Views on Vision4Press platform.
Data correspond to usage on the plateform after 2015. The current usage metrics is available 48-96 hours after online publication and is updated daily on week days.
Initial download of the metrics may take a while.