Fig. 3
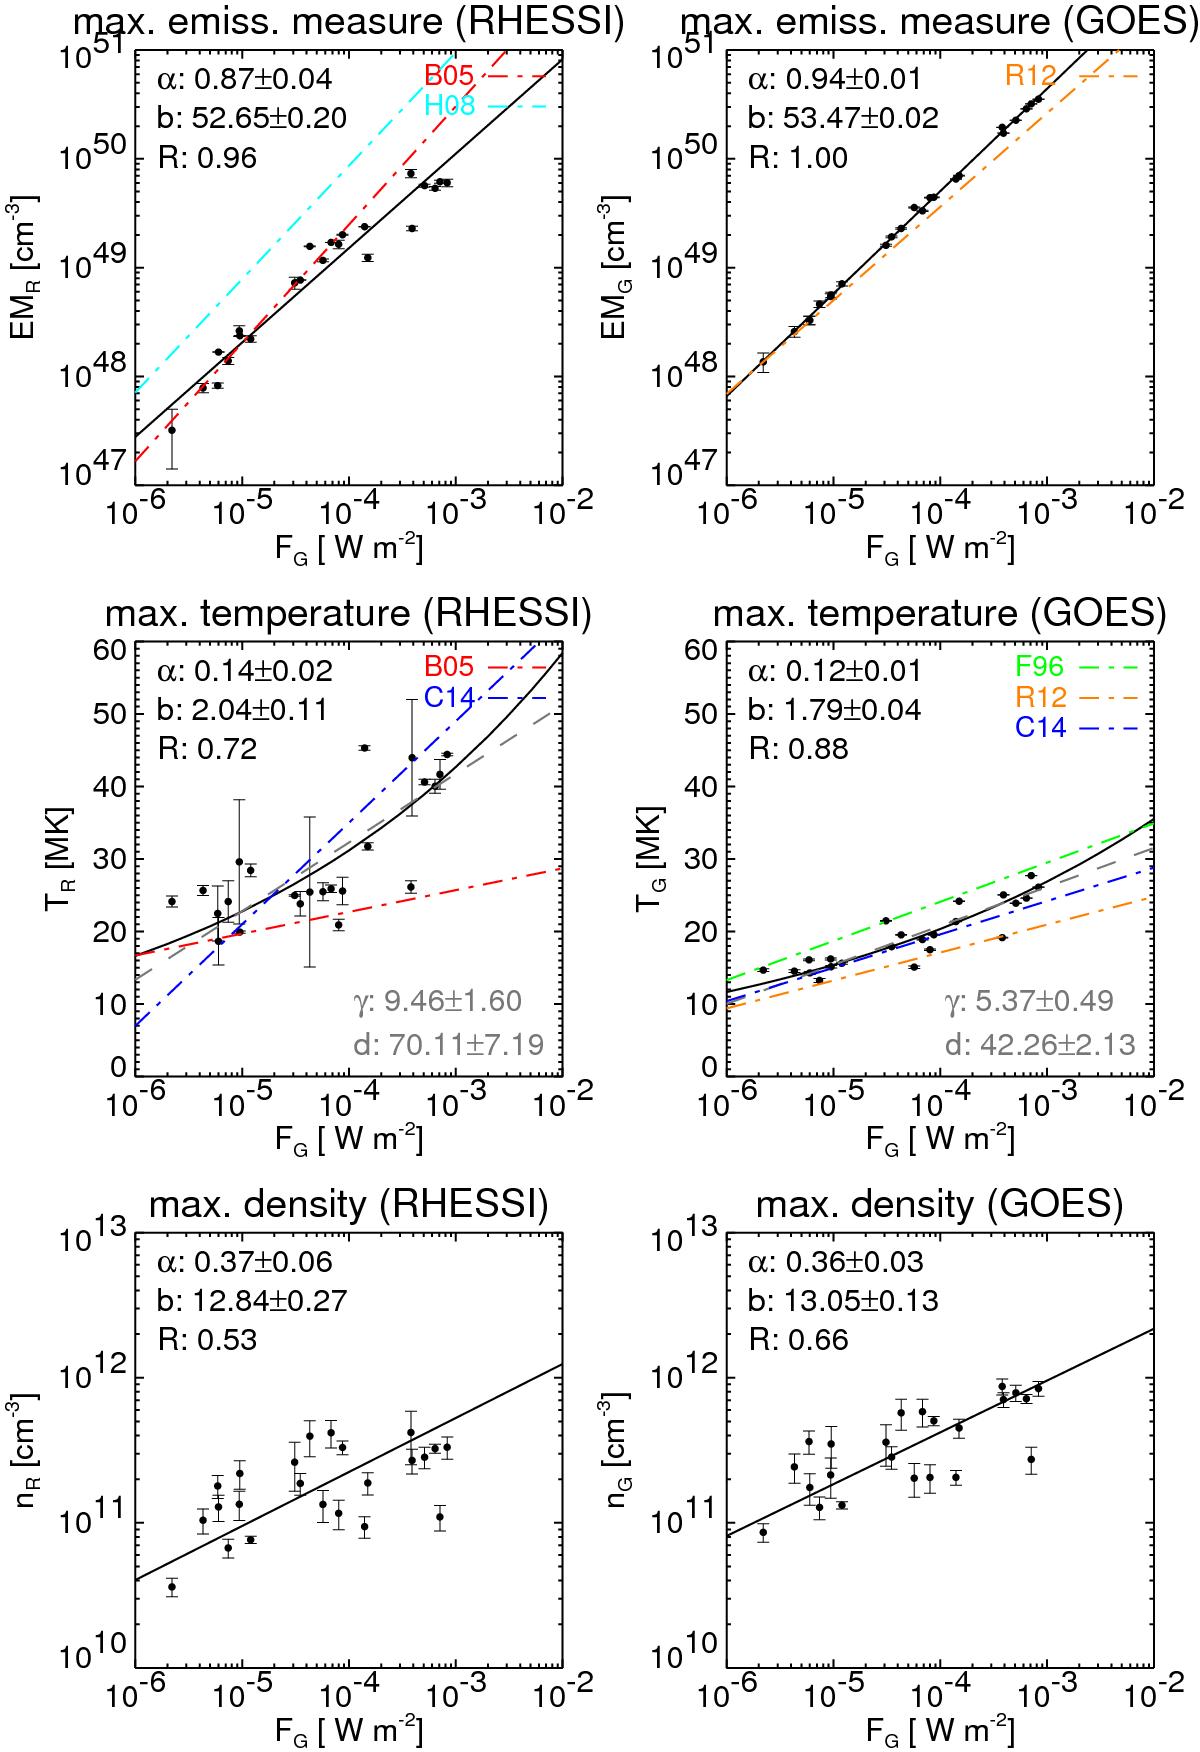
Thermal parameters as a function of background-subtracted GOES peak flux. Shown are the maxima of the emission measure EM (top), temperature T (middle), and electron density n (bottom) derived from RHESSI (left column) and GOES data (right column). Also shown are power-law fits obtained with the BCES bisector method (full black line). The slope α and intercept b of the obtained power law are shown together with the rank correlation coefficient R . Additionally, an exponential fit is shown for the temperatures (dashed gray lines), and the corresponding fit parameters γ and d are indicated (see main text). Where appropriate, correlations found by the following studies are indicated by dash-dotted lines: Feldman et al. (1996), Battaglia et al. (2005), Hannah et al. (2008), Ryan et al. (2012), Caspi et al. (2014a).
Current usage metrics show cumulative count of Article Views (full-text article views including HTML views, PDF and ePub downloads, according to the available data) and Abstracts Views on Vision4Press platform.
Data correspond to usage on the plateform after 2015. The current usage metrics is available 48-96 hours after online publication and is updated daily on week days.
Initial download of the metrics may take a while.