Fig. 9
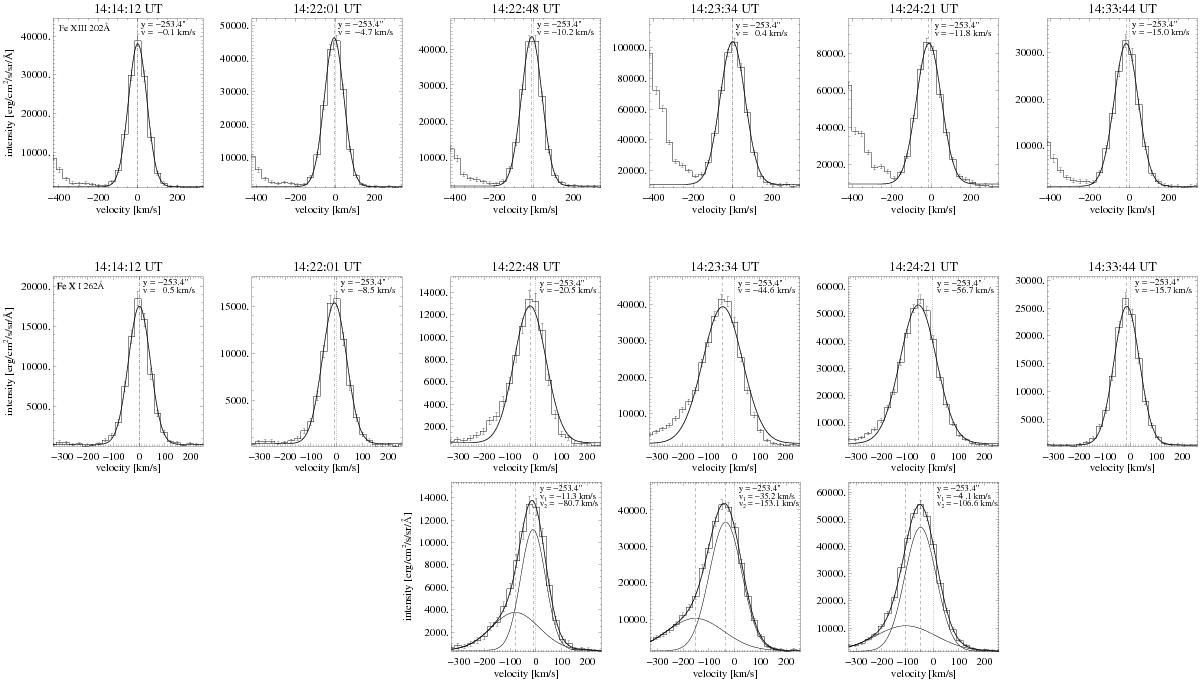
Representative examples of Fe xiii 202 Å (top row) and Fe xvi 262 Å (middle and bottom rows) spectral line profiles and their fits for particular phases of the flare evolution, i.e., early pre-flare period (first column), impulsive phase (second to fifth column), and decline phase (last column). The top and middle rows show the profiles fitted by a single-Gaussian function. The bottom row displays results obtained from two-component fitting of the asymmetric Fe xvi 262 Å spectral profiles detected during the impulsive phase of the flare. The histograms show the observed spectral profiles. The error bars mark the standard deviation for each intensity value. Solid lines represent final fits and individual spectral components (bottom row). Vertical dotted lines indicate the position of zero Doppler shifts, while the vertical dashed lines highlight the values of Doppler shifts determined for particular components of the fit. The positions along the slit together with the determined values of Doppler shifts are inserted in the upper right corner of each panel.
Current usage metrics show cumulative count of Article Views (full-text article views including HTML views, PDF and ePub downloads, according to the available data) and Abstracts Views on Vision4Press platform.
Data correspond to usage on the plateform after 2015. The current usage metrics is available 48-96 hours after online publication and is updated daily on week days.
Initial download of the metrics may take a while.