Free Access
Fig. 7
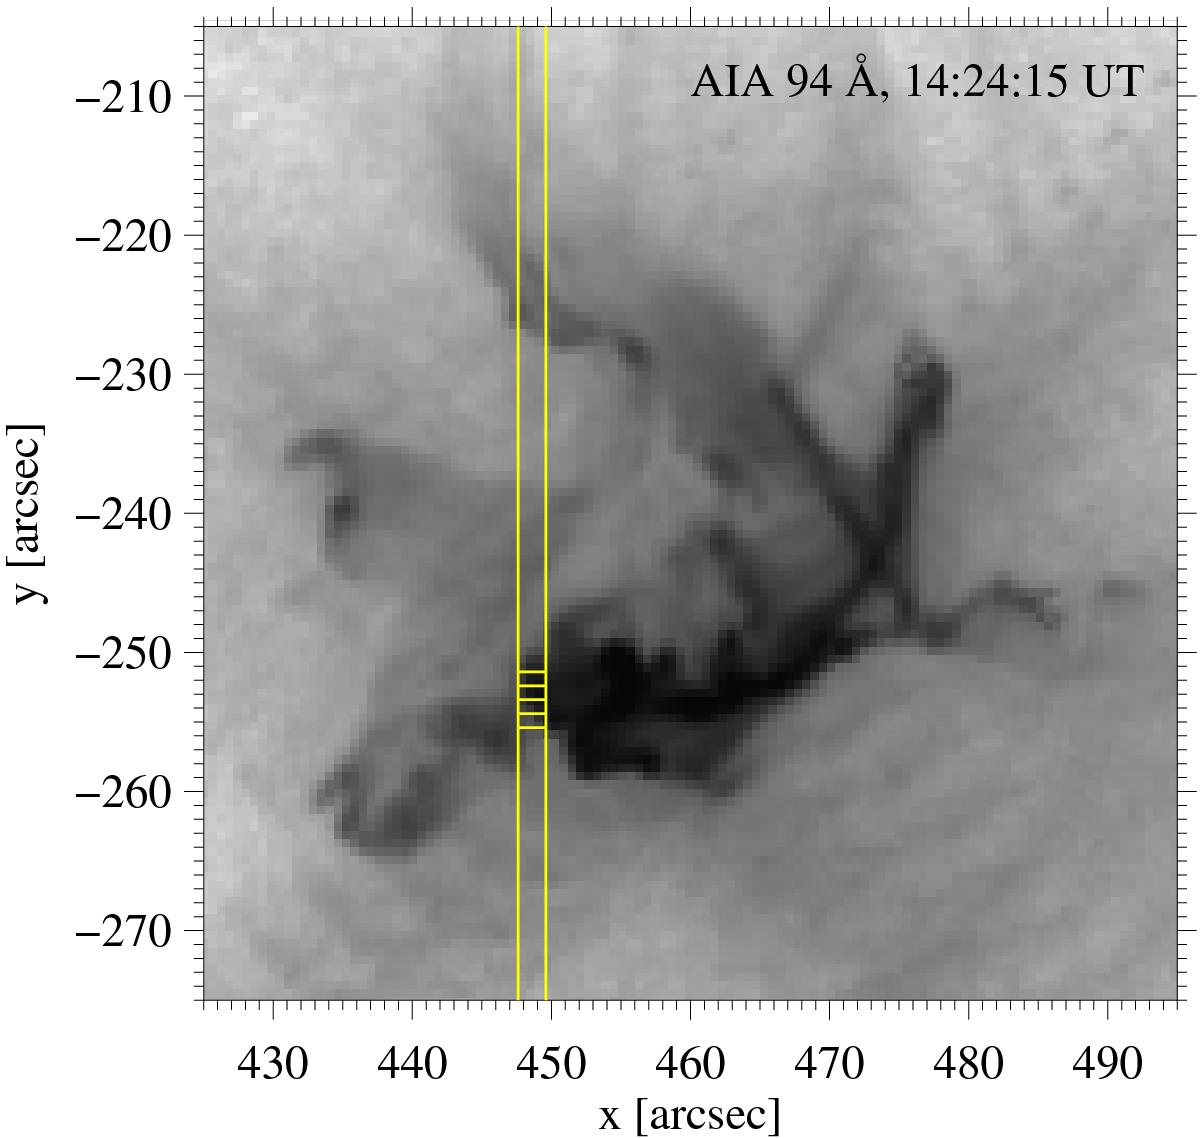
Position of the EIS slit (yellow vertical lines) superimposed on an AIA 94 Å image, taken during the impulsive phase of the flare at 14:24:15 UT. The yellow rectangles highlight the EIS pixels we used to study the temporal evolution of the intensities and Doppler shifts shown in Fig. 8.
Current usage metrics show cumulative count of Article Views (full-text article views including HTML views, PDF and ePub downloads, according to the available data) and Abstracts Views on Vision4Press platform.
Data correspond to usage on the plateform after 2015. The current usage metrics is available 48-96 hours after online publication and is updated daily on week days.
Initial download of the metrics may take a while.