Fig. 6
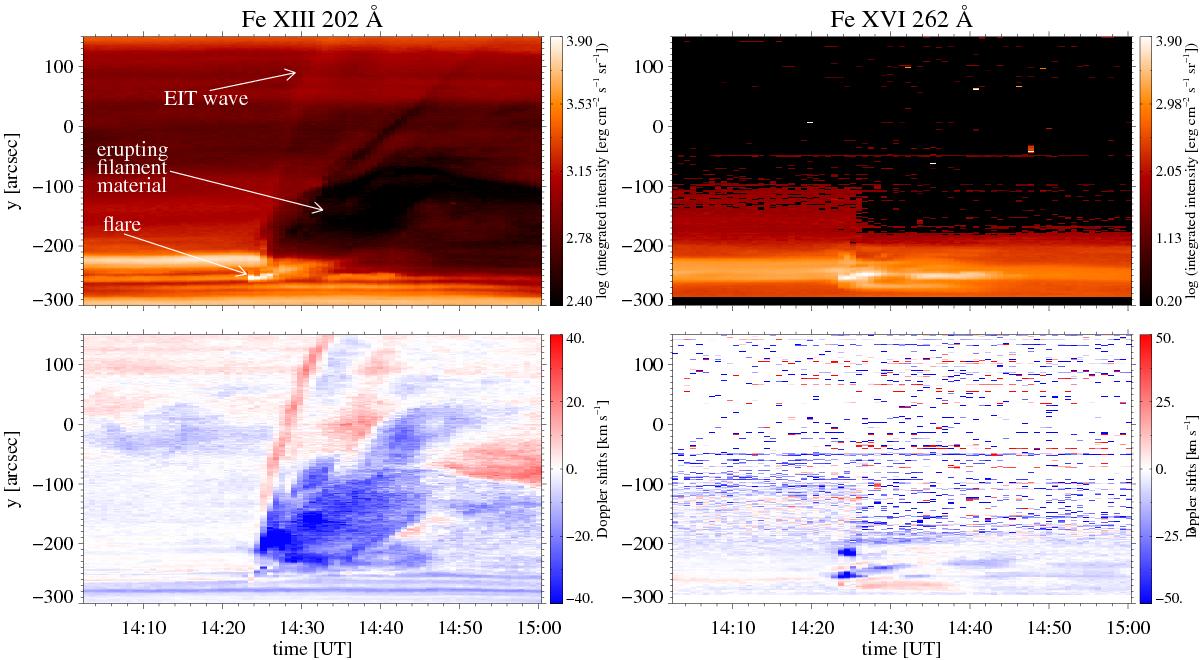
Time-space maps of the Fe xiii 202 Å and Fe xvi 262 Å intensities (top panels) and Doppler shifts (bottom panels). The temporal evolution of the observed flare is visible in the region between –260′′ and –250′′ along the slit. Observed features (EIT wave, erupting filament, and flare) are marked by arrows in the Fe xiii 202 Å intensity map.
Current usage metrics show cumulative count of Article Views (full-text article views including HTML views, PDF and ePub downloads, according to the available data) and Abstracts Views on Vision4Press platform.
Data correspond to usage on the plateform after 2015. The current usage metrics is available 48-96 hours after online publication and is updated daily on week days.
Initial download of the metrics may take a while.