Fig. 5
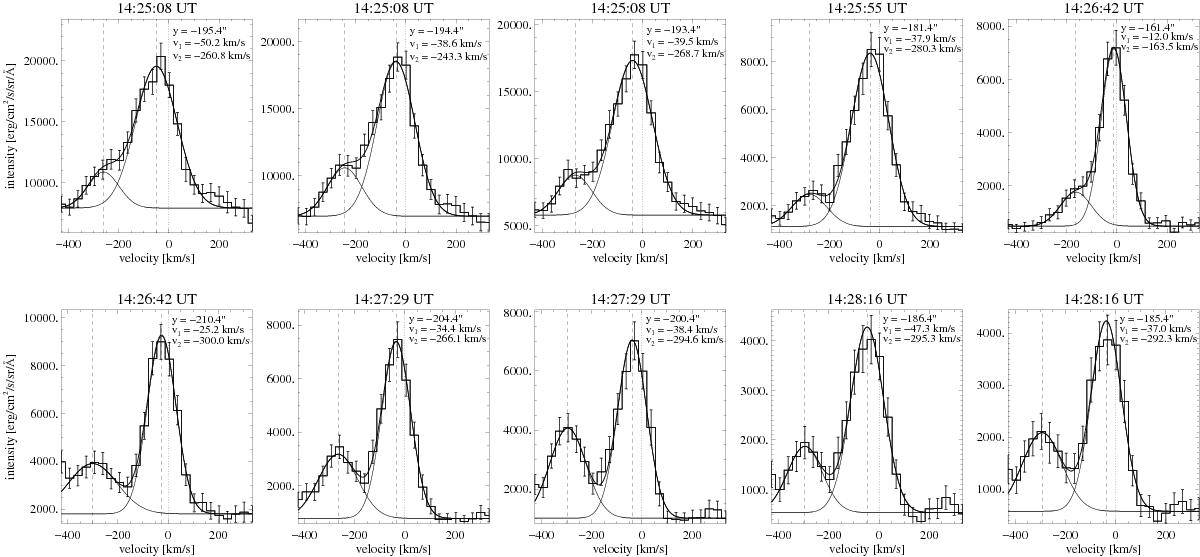
Representative examples demonstrating the two-component character of the Fe xiii 202 Å spectral profiles related to the erupting filament material (the top row represents the leading and the bottom row the following part of the ejected filament marked by the arrows in the 5th and 6th panel of Fig. 3). The histograms show the observed spectral profiles. The standard deviation of the line intensity is indicated by error bars. The individual spectral components and the resulting fits are plotted with solid lines. Vertical dotted lines show the position of the zero Doppler shifts, while the vertical dashed lines highlight the values of Doppler shifts determined for particular components of the fit. The positions along the slit together with the determined values of Doppler shifts are given in the upper right corner of each panel.
Current usage metrics show cumulative count of Article Views (full-text article views including HTML views, PDF and ePub downloads, according to the available data) and Abstracts Views on Vision4Press platform.
Data correspond to usage on the plateform after 2015. The current usage metrics is available 48-96 hours after online publication and is updated daily on week days.
Initial download of the metrics may take a while.