Fig. 4
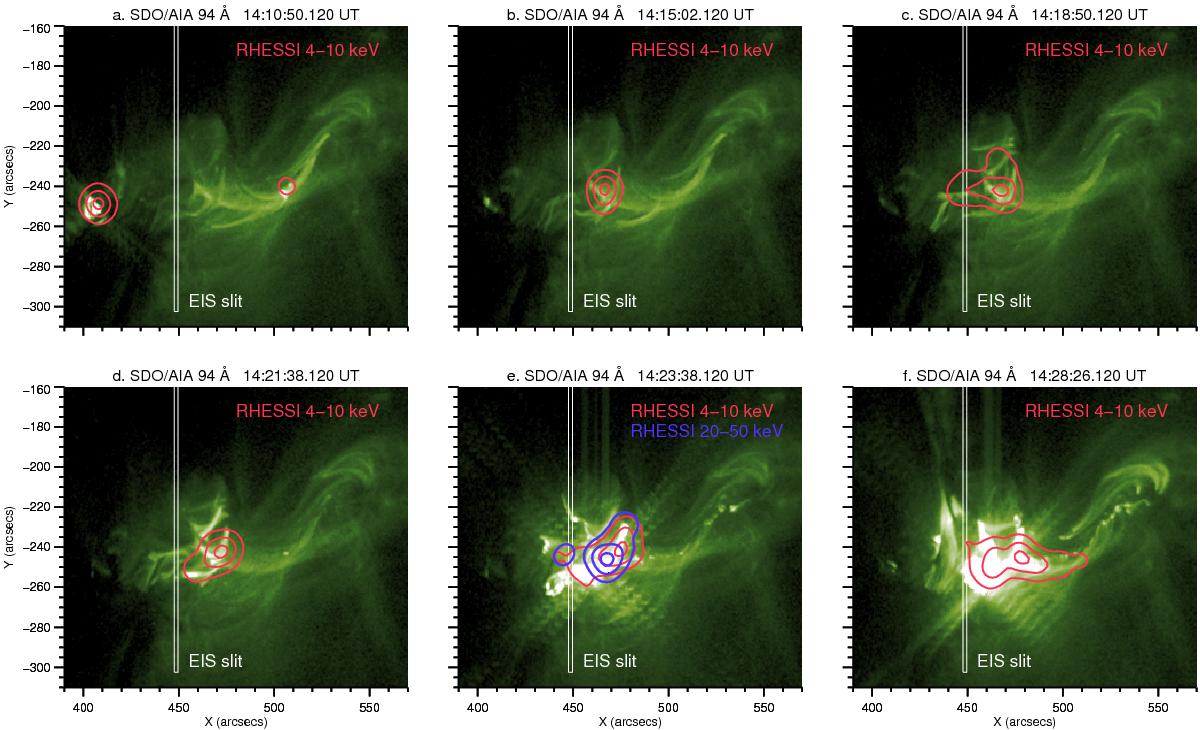
SDO/AIA 94 Å images at six different times, as indicated in the X-ray light curves plotted in Fig. 1. These images show the evolution of flare loops at a temperature around 6 MK. RHESSI X-ray sources are shown as contours in red (4–10 keV) and blue (20–50 keV). They show the locations of X-ray-emitting thermal plasma and nonthermal electrons. The contour levels are 5, 30, and 80% of the peak intensity. The white rectangle depicts the lower part of the Hinode/EIS slit.
Current usage metrics show cumulative count of Article Views (full-text article views including HTML views, PDF and ePub downloads, according to the available data) and Abstracts Views on Vision4Press platform.
Data correspond to usage on the plateform after 2015. The current usage metrics is available 48-96 hours after online publication and is updated daily on week days.
Initial download of the metrics may take a while.