Fig. 3
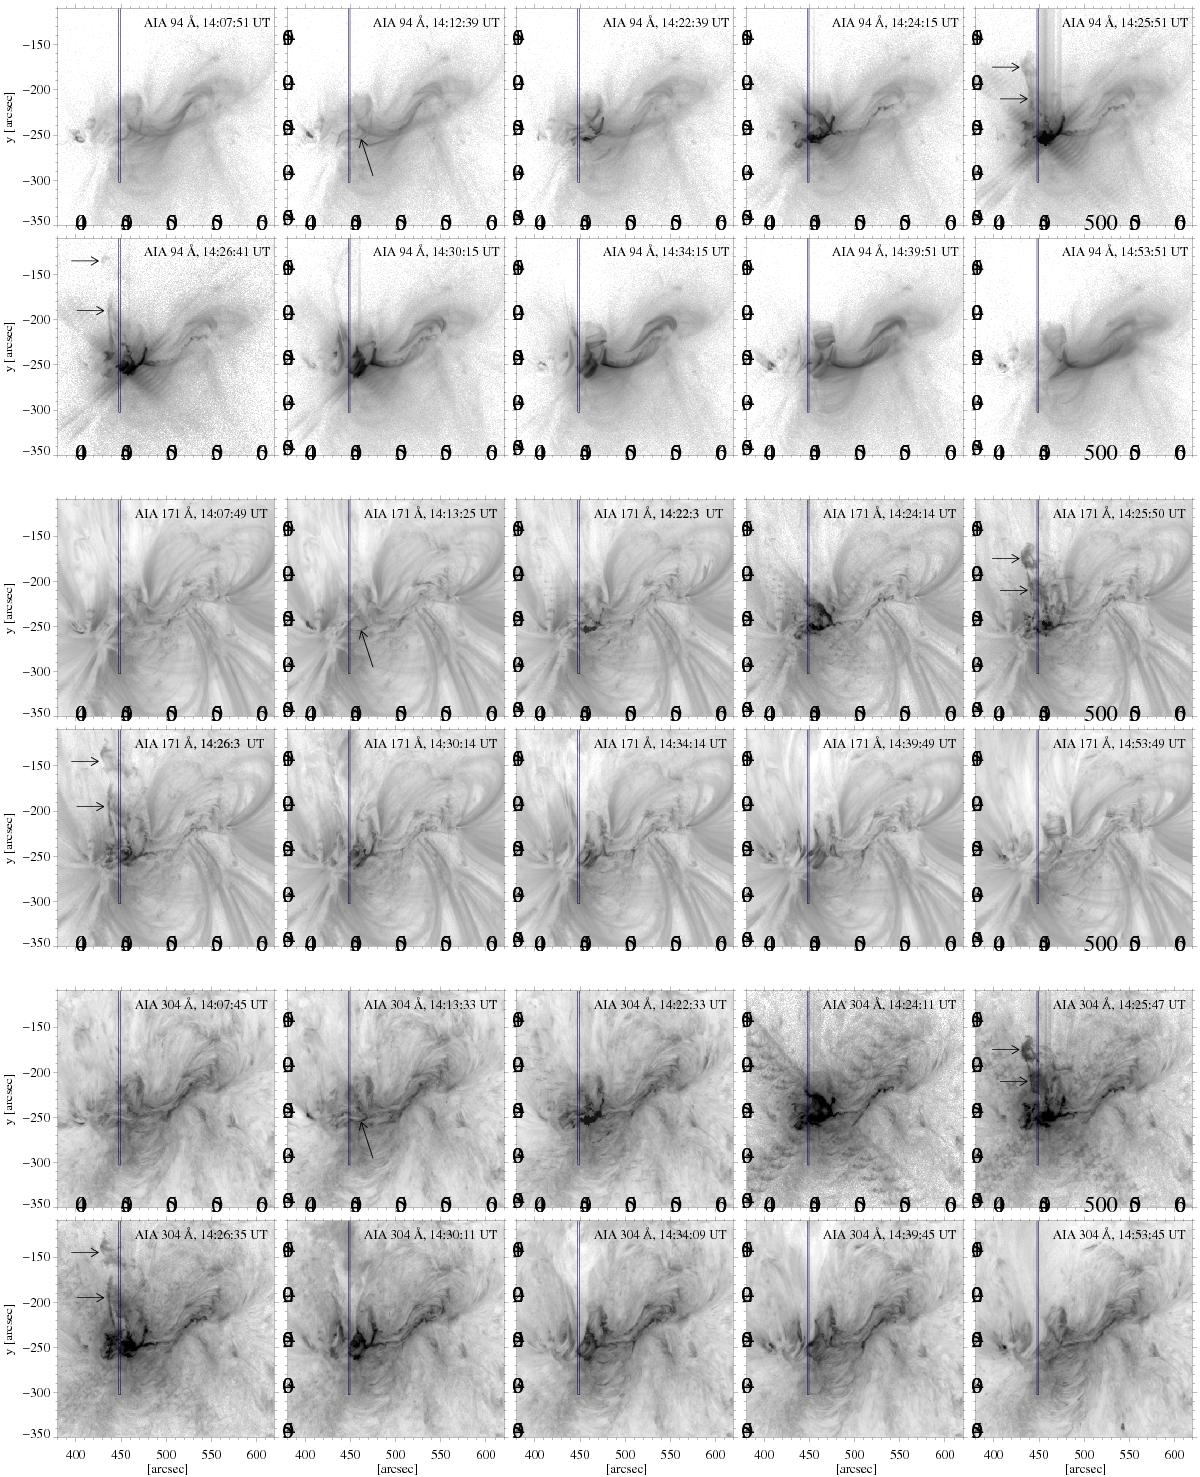
Sequence of AIA 94 Å (top two rows), 171 Å (middle two rows), and 304 Å (bottom two rows) filtergrams showing snapshots of the temporal evolution of the flare. The midpoint of the recording time of the particular images is presented in the upper right corner of each panel. The arrow in the second panel of each wavelength channel marks the appearance of a newly formed hot loop structure. The arrows in the 5th and 6th panel point to the erupting filament. The rectangles represent the position of the EIS slit. An animation of the displayed wavelength channels is shown in the attached movie.
Current usage metrics show cumulative count of Article Views (full-text article views including HTML views, PDF and ePub downloads, according to the available data) and Abstracts Views on Vision4Press platform.
Data correspond to usage on the plateform after 2015. The current usage metrics is available 48-96 hours after online publication and is updated daily on week days.
Initial download of the metrics may take a while.