Fig. 2
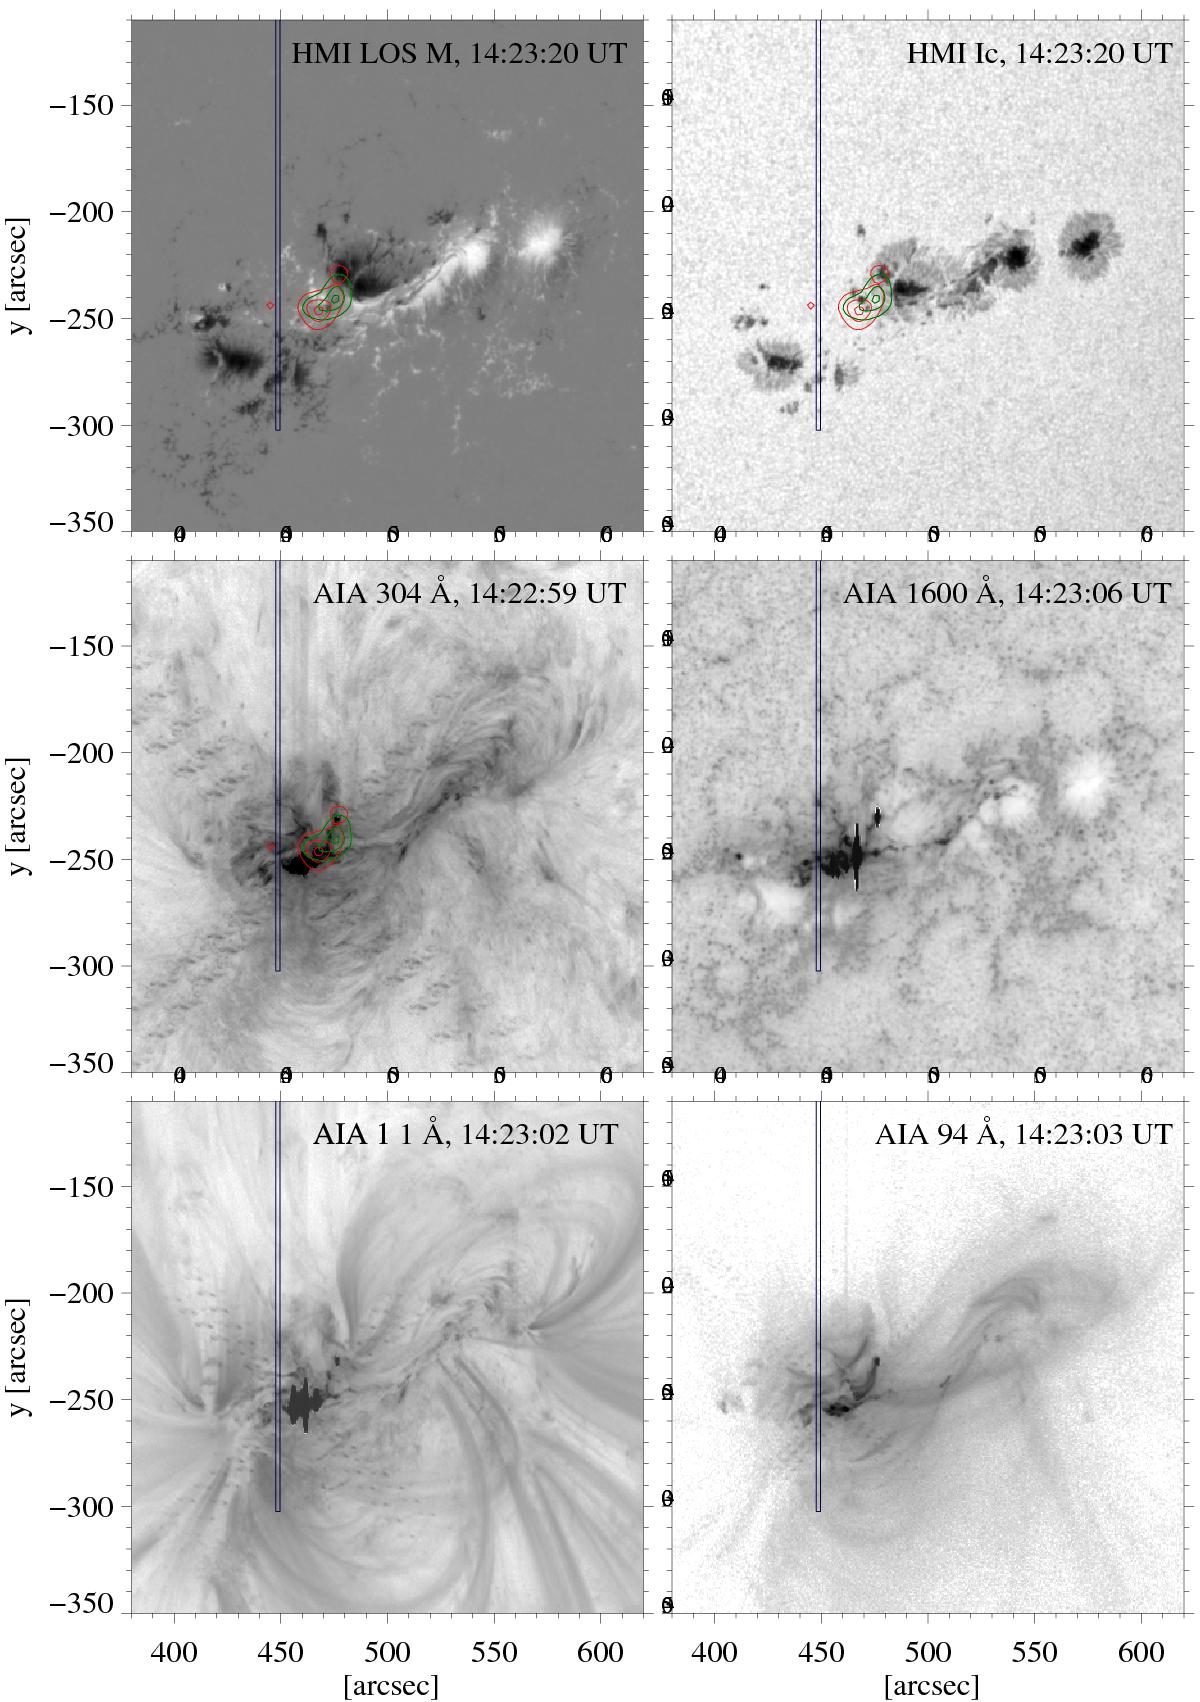
Overview images showing NOAA 11158 during the main impulsive phase of the flare. Top left and right panels show the HMI line-of-sight magnetic field and continuum intensity, respectively. Middle and bottom panels are AIA filtergrams at different wavelengths (indicated in the top right corner of each panel). They are displayed on logarithmic scale and a reversed intensity scaling. The times listed in the upper right corner of each panel correspond to the midpoint of the particular HMI or AIA exposure time. The overplotted contours show RHESSI X-ray images reconstructed in the 4–10 keV (green) and 20–50 keV (red) energy bands, with an integration time of 40 s, starting at 14:23:08 UT. The contour levels represent 10, 50, and 90% of the peak intensity. The rectangle outlines the lower part of the Hinode/EIS slit.
Current usage metrics show cumulative count of Article Views (full-text article views including HTML views, PDF and ePub downloads, according to the available data) and Abstracts Views on Vision4Press platform.
Data correspond to usage on the plateform after 2015. The current usage metrics is available 48-96 hours after online publication and is updated daily on week days.
Initial download of the metrics may take a while.