Fig. 11
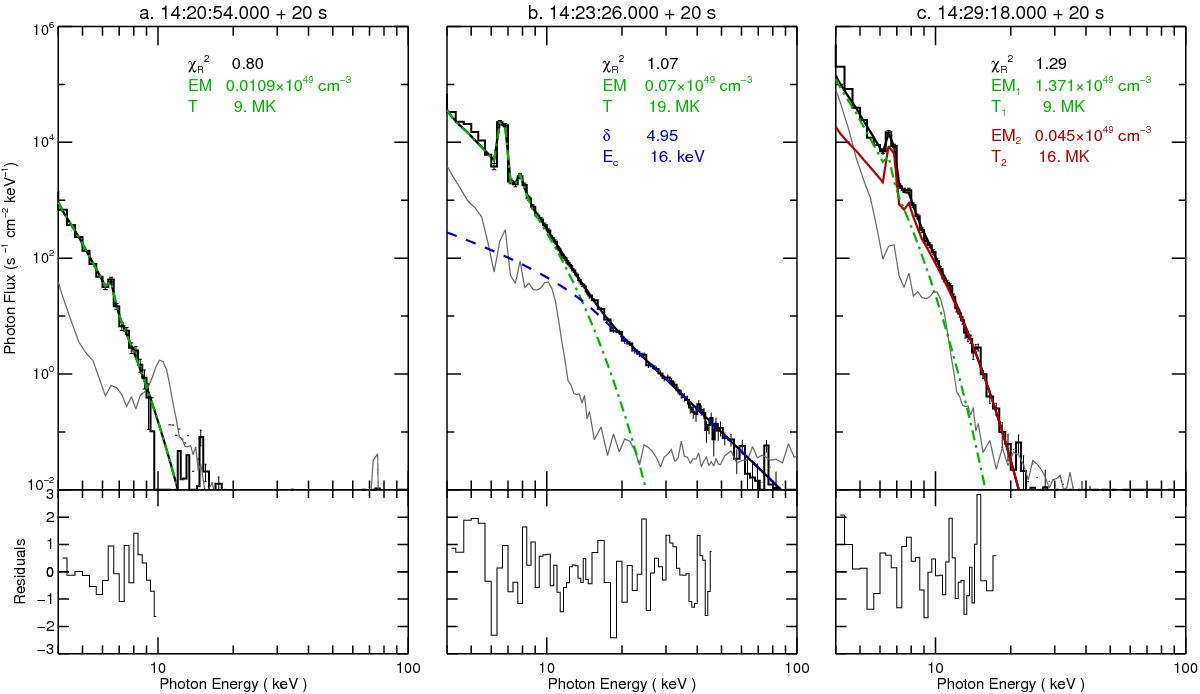
Panels a) to c), top: reconstructed X-ray spectra and fitting results. The three examples shown here were selected at the rising phase, the HXR peak, and the decay phase. These spectra were derived from detector 4 with 20 s integration time (histogram) and fitted with an isothermal component (green, dot-dashed line) and a nonthermal thick-target model (blue, dashed line). A second isothermal component (red, solid line) was added when necessary for a better fit. The gray curves represent the background. The obtained parameters, such as reduced chi-square, plasma temperature T, emission measure EM, power-law distribution index δ of the nonthermal electrons, and low-energy cutoff Ec, are listed in the top right corner of each panel. Panels a) to c), bottom: residuals from the fitting.
Current usage metrics show cumulative count of Article Views (full-text article views including HTML views, PDF and ePub downloads, according to the available data) and Abstracts Views on Vision4Press platform.
Data correspond to usage on the plateform after 2015. The current usage metrics is available 48-96 hours after online publication and is updated daily on week days.
Initial download of the metrics may take a while.