Fig. 9
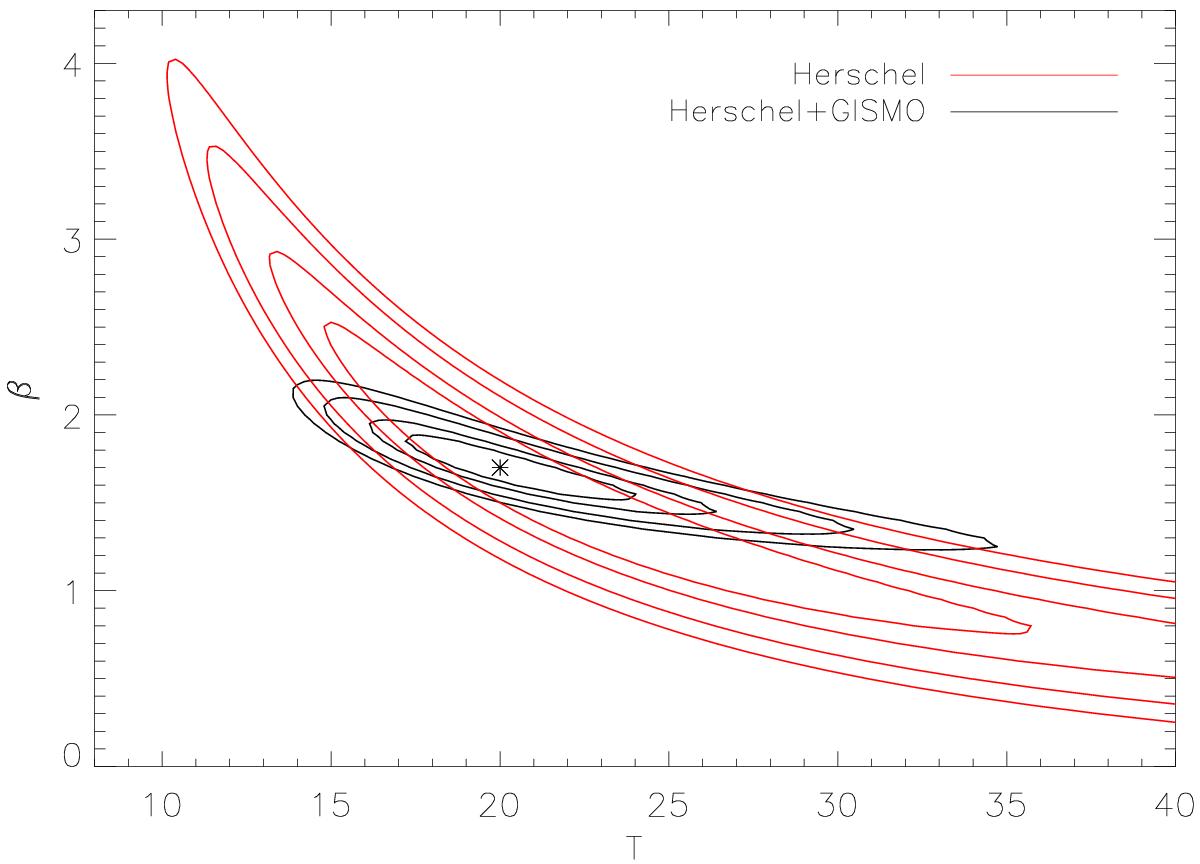
Reduced χ2 contours from SED-fitting to Herschel+2mm data (black) and Herschel-only data (red) for mock data corresponding to T = 20 K and β = 1.7. Contours correspond to reduced χ2 values of ![]() 1.0, 2.0, and 3.0, assuming four degrees of freedom for the Herschel+2mm data and three degrees for the Herschel-only data. The star shows the input temperature and β values from our model.
1.0, 2.0, and 3.0, assuming four degrees of freedom for the Herschel+2mm data and three degrees for the Herschel-only data. The star shows the input temperature and β values from our model.
Current usage metrics show cumulative count of Article Views (full-text article views including HTML views, PDF and ePub downloads, according to the available data) and Abstracts Views on Vision4Press platform.
Data correspond to usage on the plateform after 2015. The current usage metrics is available 48-96 hours after online publication and is updated daily on week days.
Initial download of the metrics may take a while.