Fig. 8
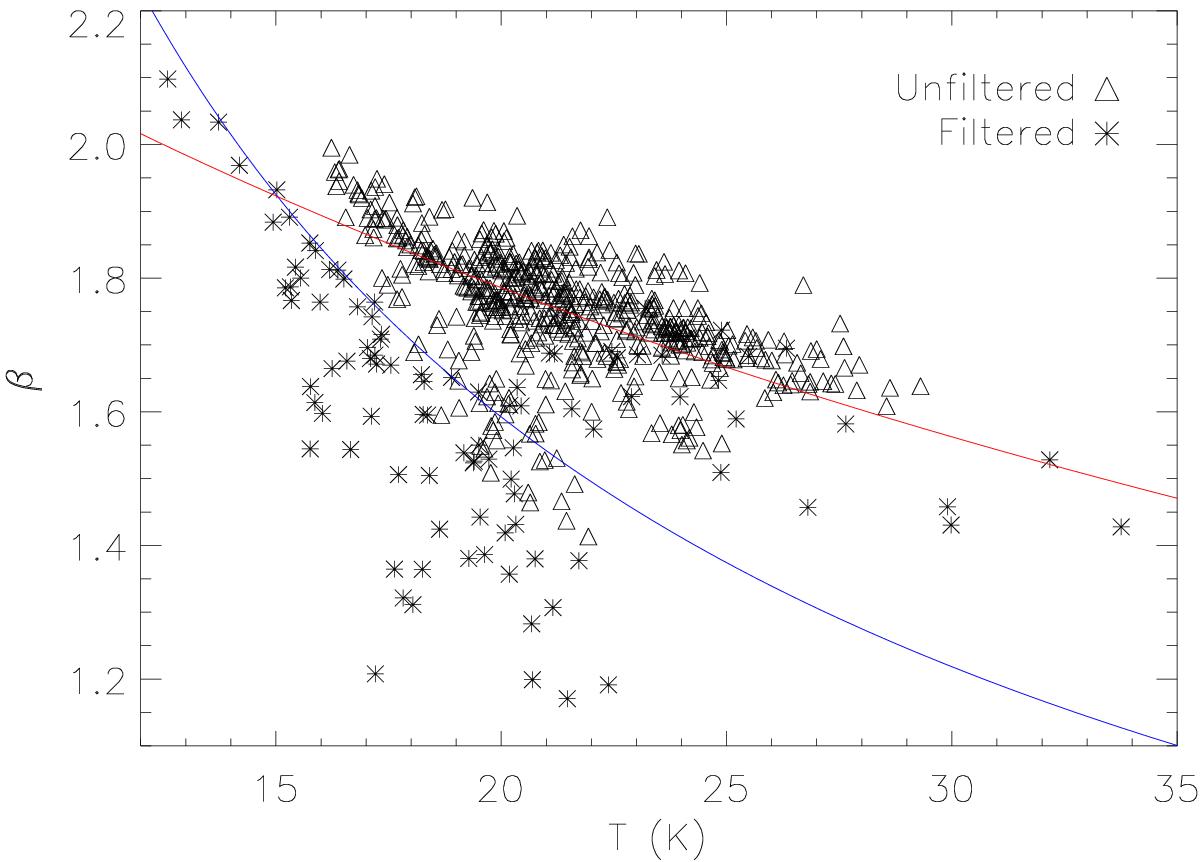
Relationship between temperature and β in OMC 2/3. Triangles show the results from our unfiltered data and stars the results from the filtered data for pixels with N(H2) > 2 × 1022 cm-2. The red curve shows the T − β relation from Dupac et al. (2003) and the blue curve shows the relation from Désert et al. (2008).
Current usage metrics show cumulative count of Article Views (full-text article views including HTML views, PDF and ePub downloads, according to the available data) and Abstracts Views on Vision4Press platform.
Data correspond to usage on the plateform after 2015. The current usage metrics is available 48-96 hours after online publication and is updated daily on week days.
Initial download of the metrics may take a while.