Fig. 6
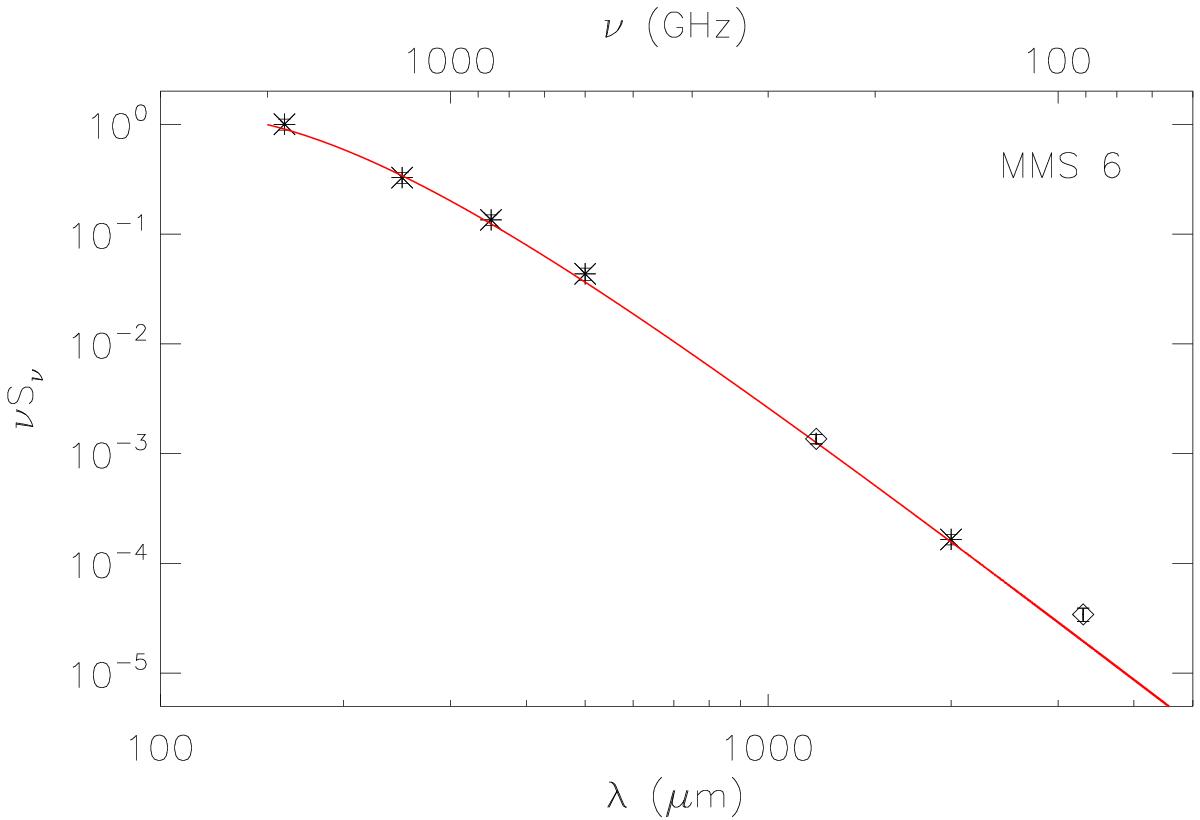
Spectral energy distribution for MMS 6. Stars correspond to Herschel and GISMO 2 mm fluxes and diamonds show MAMBO 1.2 mm and MUSTANG 3.3 mm data from Schnee et al. (2014) for this source. The red curve shows the best-fit SED to the Herschel+GISMO data alone (see Table 1). Error bars show a 10% flux uncertainty, representative of typical calibration errors.
Current usage metrics show cumulative count of Article Views (full-text article views including HTML views, PDF and ePub downloads, according to the available data) and Abstracts Views on Vision4Press platform.
Data correspond to usage on the plateform after 2015. The current usage metrics is available 48-96 hours after online publication and is updated daily on week days.
Initial download of the metrics may take a while.