Fig. A.3
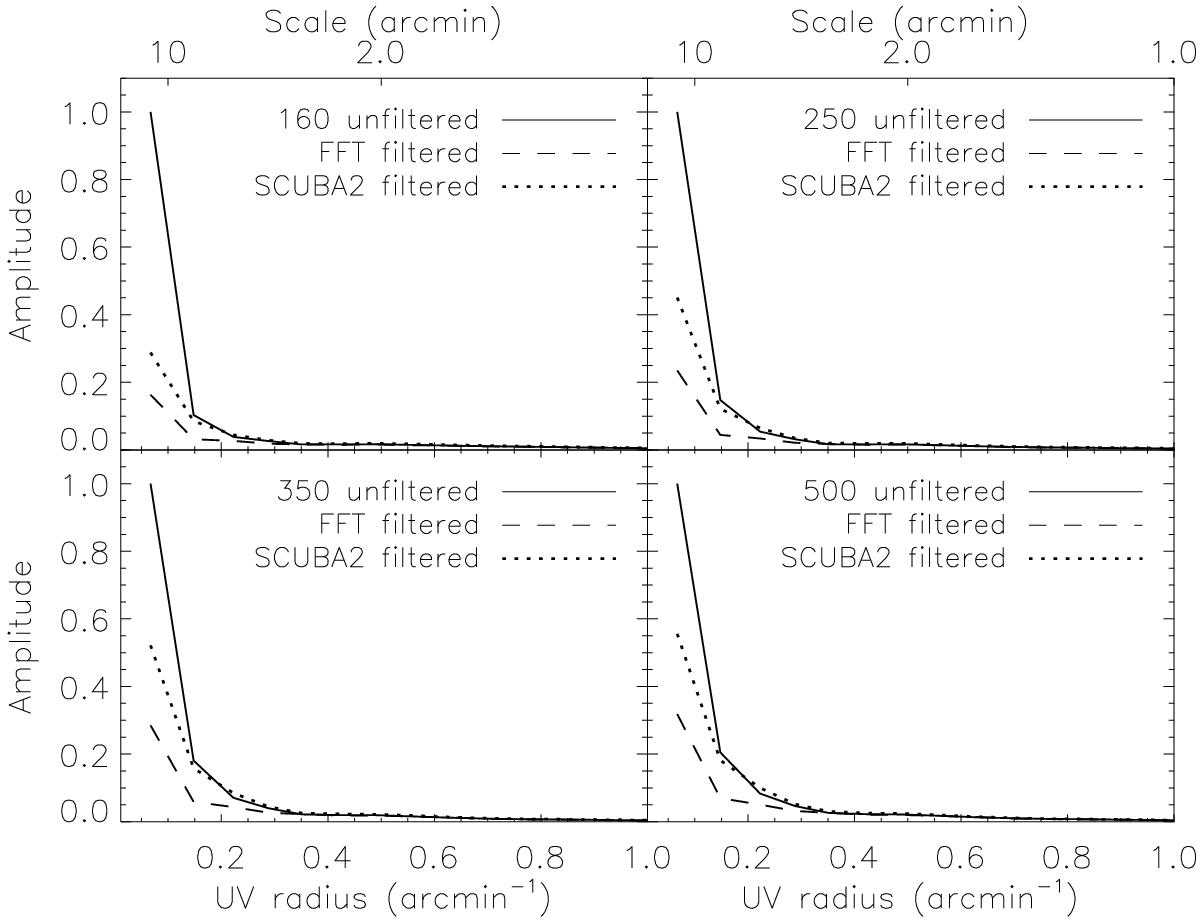
Same as Fig. A.2, but for a 64 × 64 pixel region of B1 in Perseus (Sadavoy et al. 2013). The dotted curves show the amplitude profiles for the corresponding Herschel maps that were filtered by the SCUBA-2 pipeline.
Current usage metrics show cumulative count of Article Views (full-text article views including HTML views, PDF and ePub downloads, according to the available data) and Abstracts Views on Vision4Press platform.
Data correspond to usage on the plateform after 2015. The current usage metrics is available 48-96 hours after online publication and is updated daily on week days.
Initial download of the metrics may take a while.