Fig. A.2
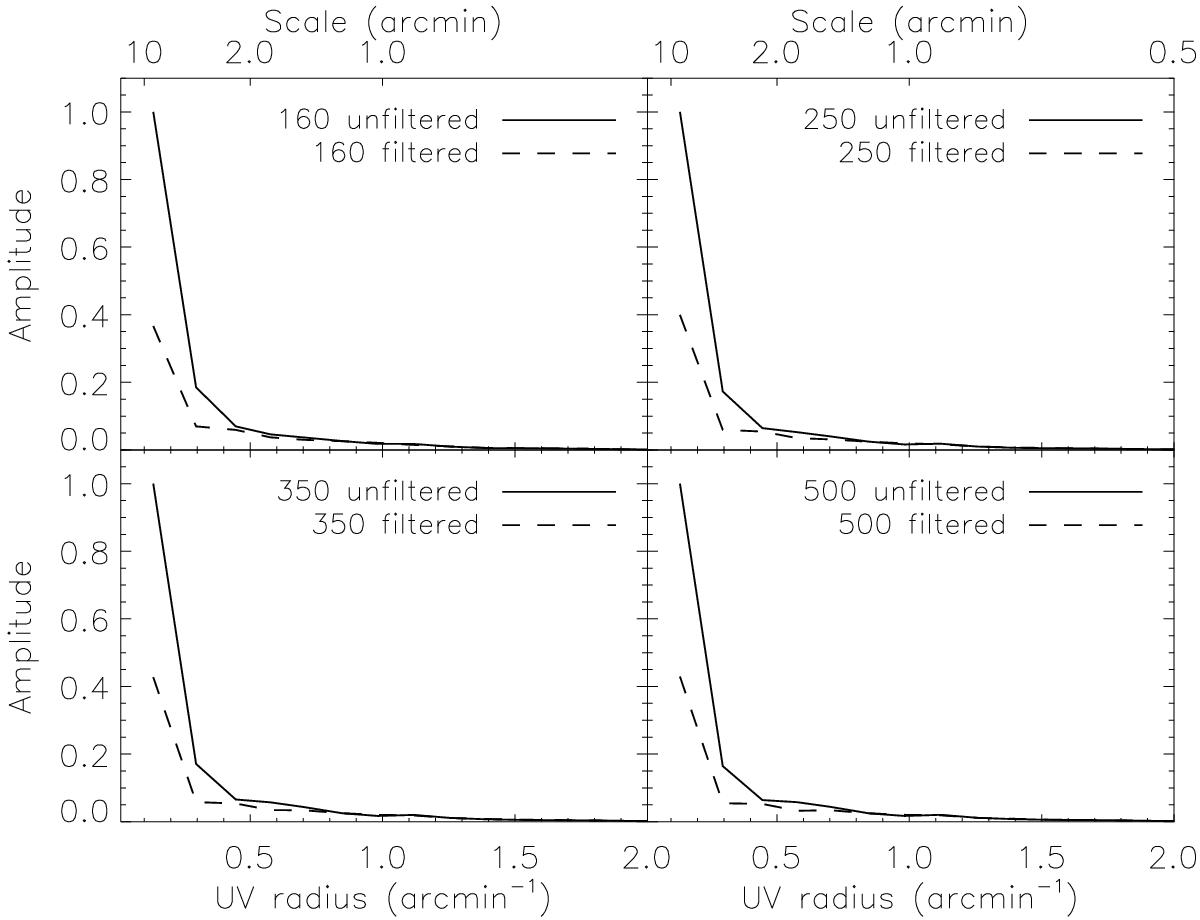
Radial amplitude profiles for the Herschel bands for a 32 × 64 pixel region of OMC 2/3. The solid curves show the observed (unfiltered) amplitude profiles, normalized by the peak value. The dashed curves show the amplitude profiles of our filtered data following our large-scale masking. The filtered profiles were scaled by the same normalization factors as the unfiltered profiles. All data are relative to the 36′′ convolved Herschel data.
Current usage metrics show cumulative count of Article Views (full-text article views including HTML views, PDF and ePub downloads, according to the available data) and Abstracts Views on Vision4Press platform.
Data correspond to usage on the plateform after 2015. The current usage metrics is available 48-96 hours after online publication and is updated daily on week days.
Initial download of the metrics may take a while.