Fig. 1
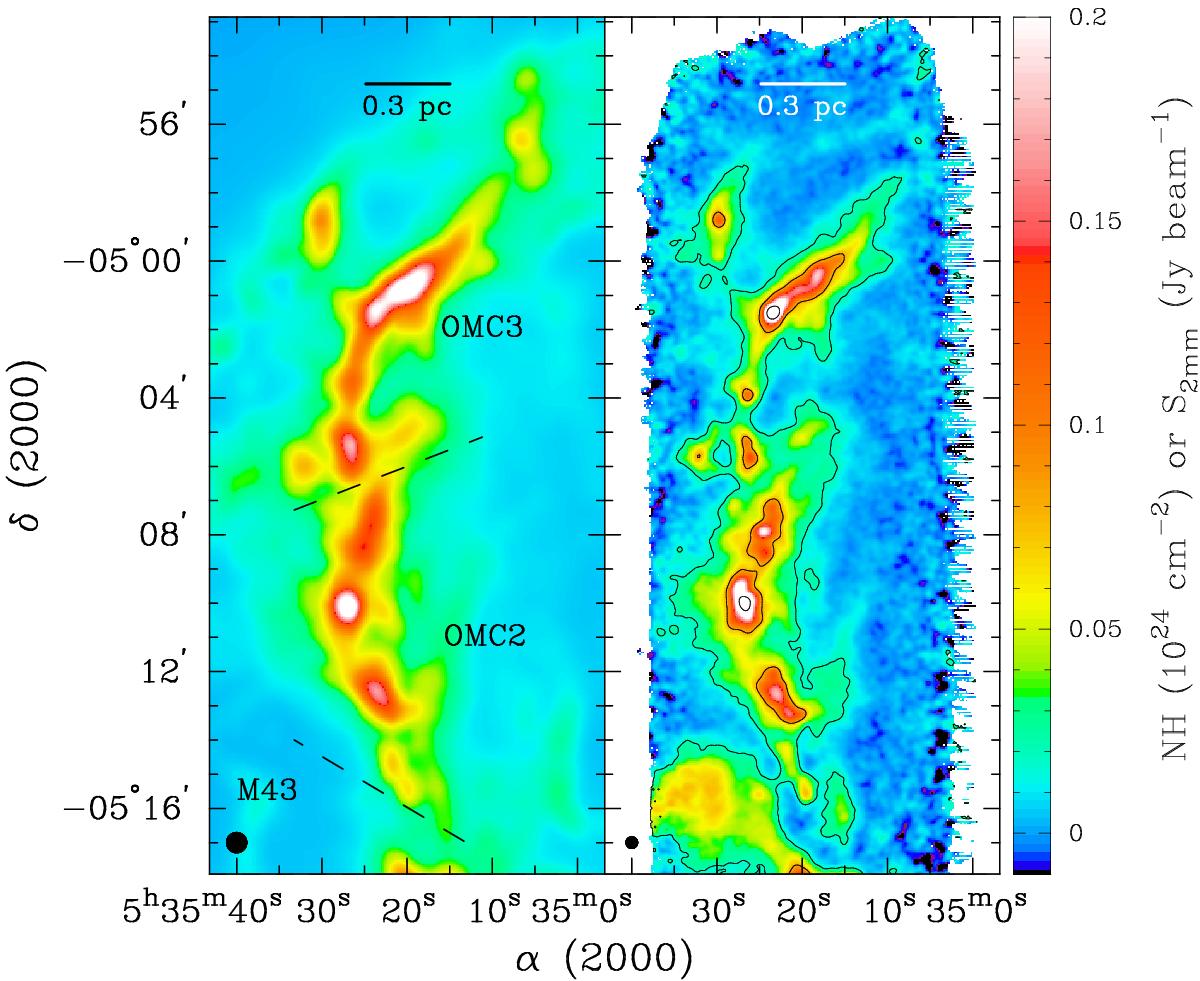
Observations of OMC 2/3. Left: column densities from Stutz & Kainulainen (2015) at ~36′′ resolution and assuming a fixed dust opacity law. The complexes are separated by dashed lines based on Chini et al. (1997). The H ii region, M 43, is also labeled. Right: IRAM 2 mm observations at 21′′ resolution. Contours show 2 mm flux density levels of 0.02, 0.08, 0.3, and 1 Jy beam-1. Respective beams are shown in the the lower left corners.
Current usage metrics show cumulative count of Article Views (full-text article views including HTML views, PDF and ePub downloads, according to the available data) and Abstracts Views on Vision4Press platform.
Data correspond to usage on the plateform after 2015. The current usage metrics is available 48-96 hours after online publication and is updated daily on week days.
Initial download of the metrics may take a while.