Fig. 7
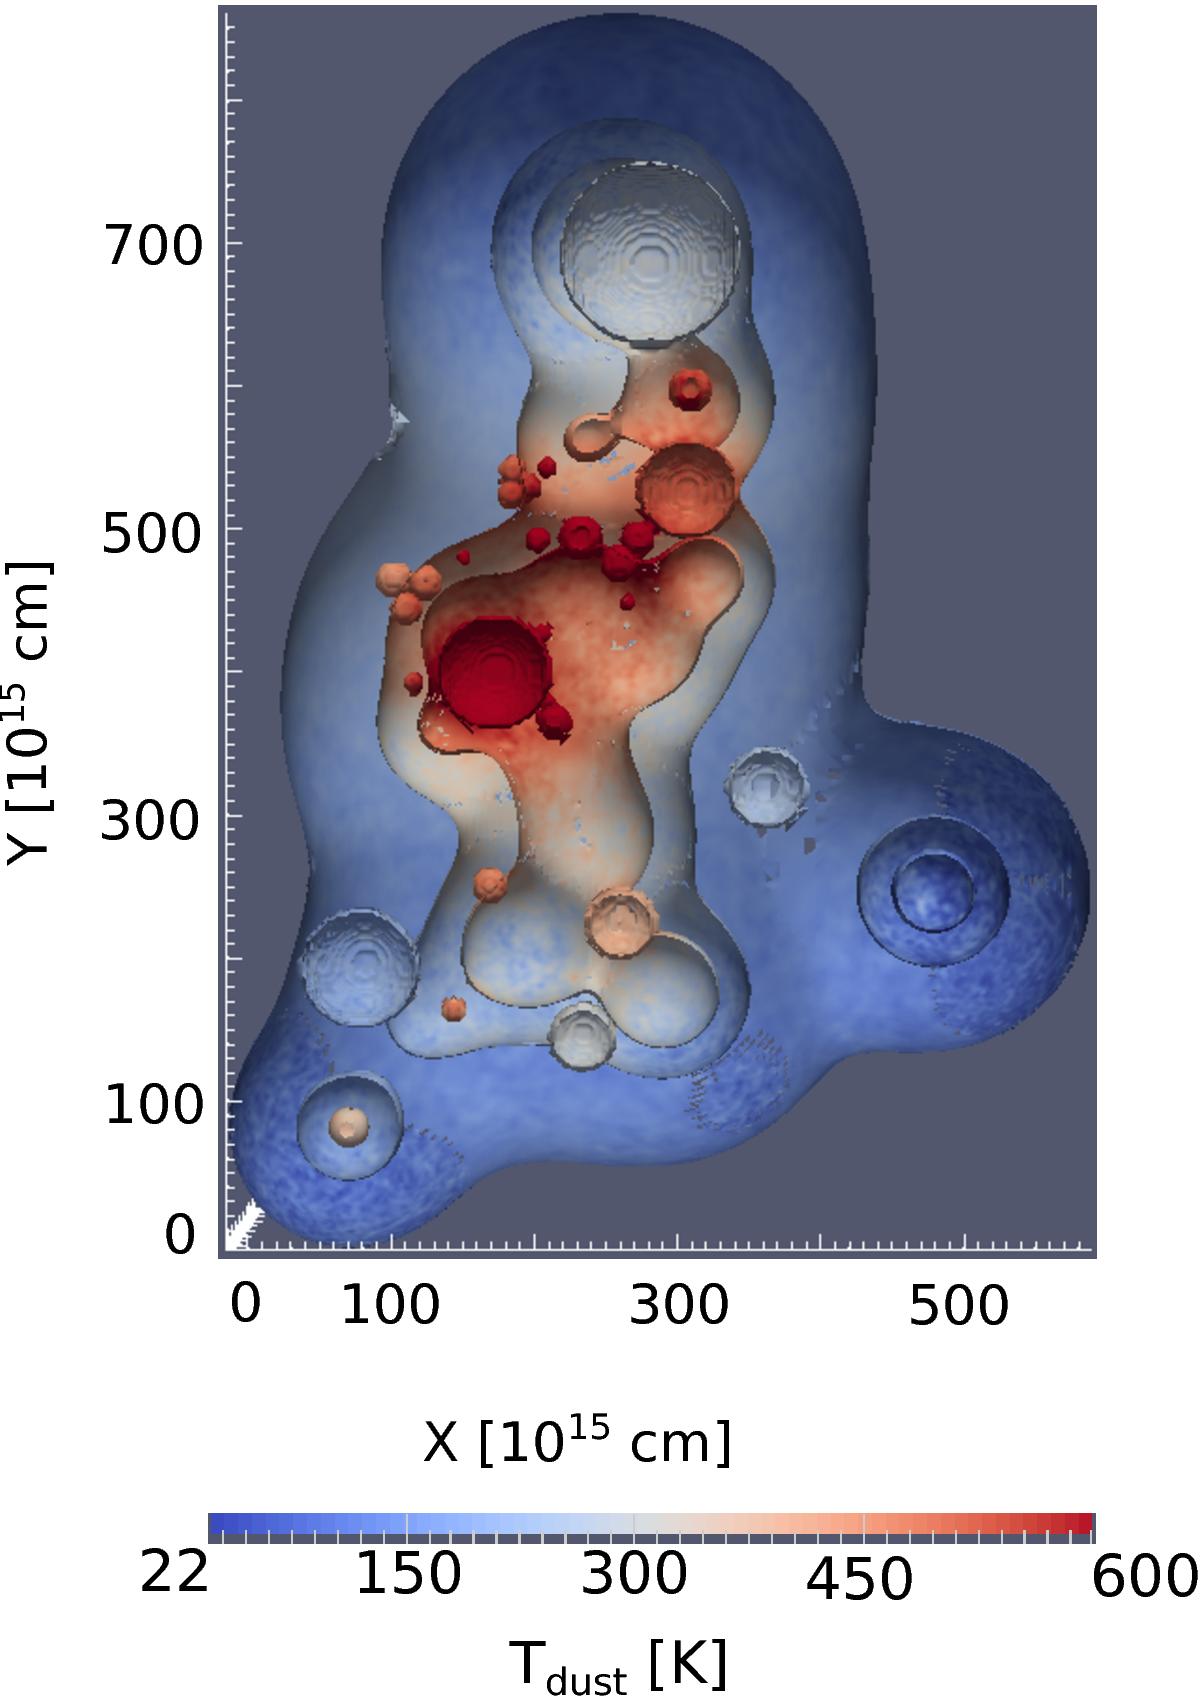
Impression of the 3d view of the dust density distribution in Sgr B2(M). Three density isocontours are presented, i.e. at densities of 10-17.5, 10-18, and 10-19 g cm-3. They are colored using the dust temperature. The model is cut open at the model center to allow us a view inside. The bubbles are the empty half-shells of the distributed Hii regions, which are free of dust. The dust on the surface of these Hii regions is heated by the UV radiation field from the young stellar object embedded in the Hii region. This dust is thus very hot, exceeding dust temperatures of 600 K (dark red spots). Visible here are mainly the Hii regions detected by (De Pree et al. 1998, F1a – F4d).
Current usage metrics show cumulative count of Article Views (full-text article views including HTML views, PDF and ePub downloads, according to the available data) and Abstracts Views on Vision4Press platform.
Data correspond to usage on the plateform after 2015. The current usage metrics is available 48-96 hours after online publication and is updated daily on week days.
Initial download of the metrics may take a while.