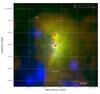
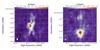
Fig. A.1
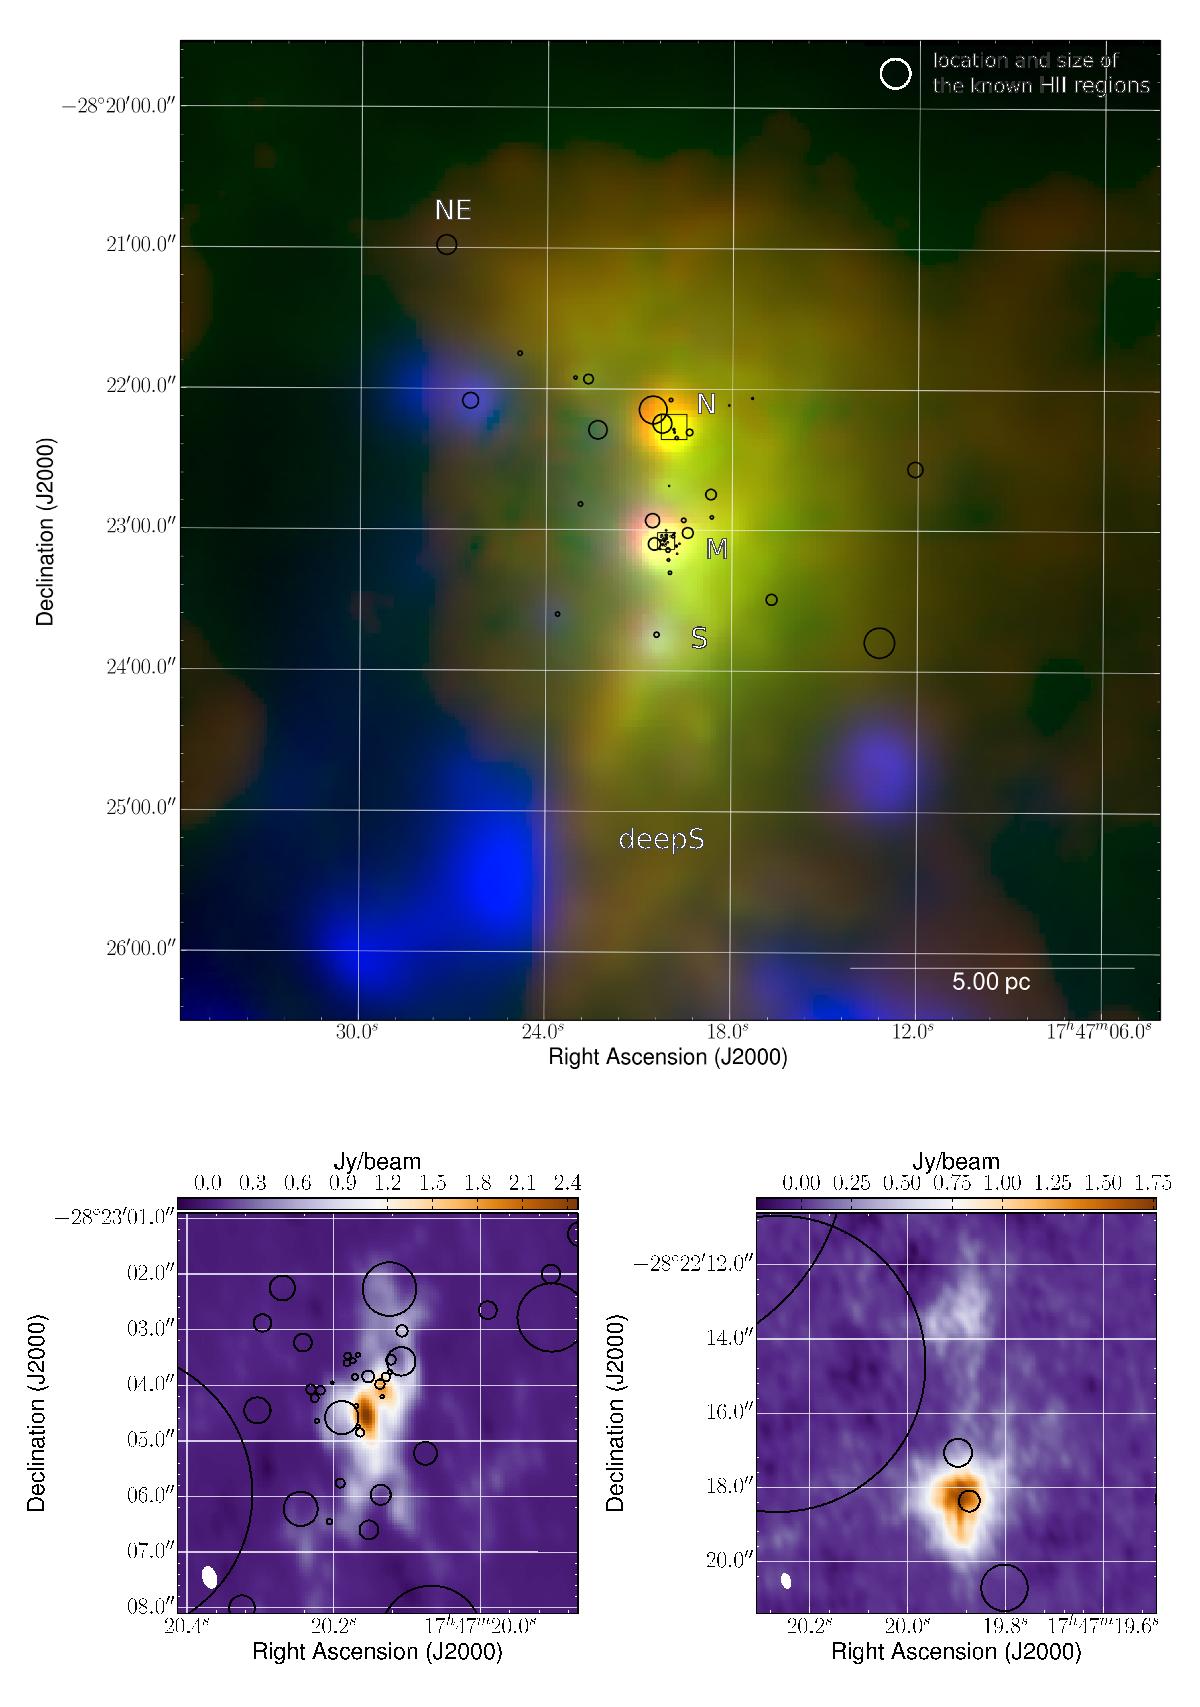
Top: three color composite map of the large-scale structure of Sgr B2. Blue: JCMT – SCUBA 850 μm, green: CSO – Sharc II 350 μm, red: Herschel/PACS 70 μm. Bottom left: zoom-in to Sgr B2(M), SMA data. Bottom right: zoom-in to Sgr B2(N), SMA data. The black circles mark the extent of the Hii regions. The rectangles in the upper map indicate the zoom-in region of the bottom maps.
Current usage metrics show cumulative count of Article Views (full-text article views including HTML views, PDF and ePub downloads, according to the available data) and Abstracts Views on Vision4Press platform.
Data correspond to usage on the plateform after 2015. The current usage metrics is available 48-96 hours after online publication and is updated daily on week days.
Initial download of the metrics may take a while.