Fig. 15
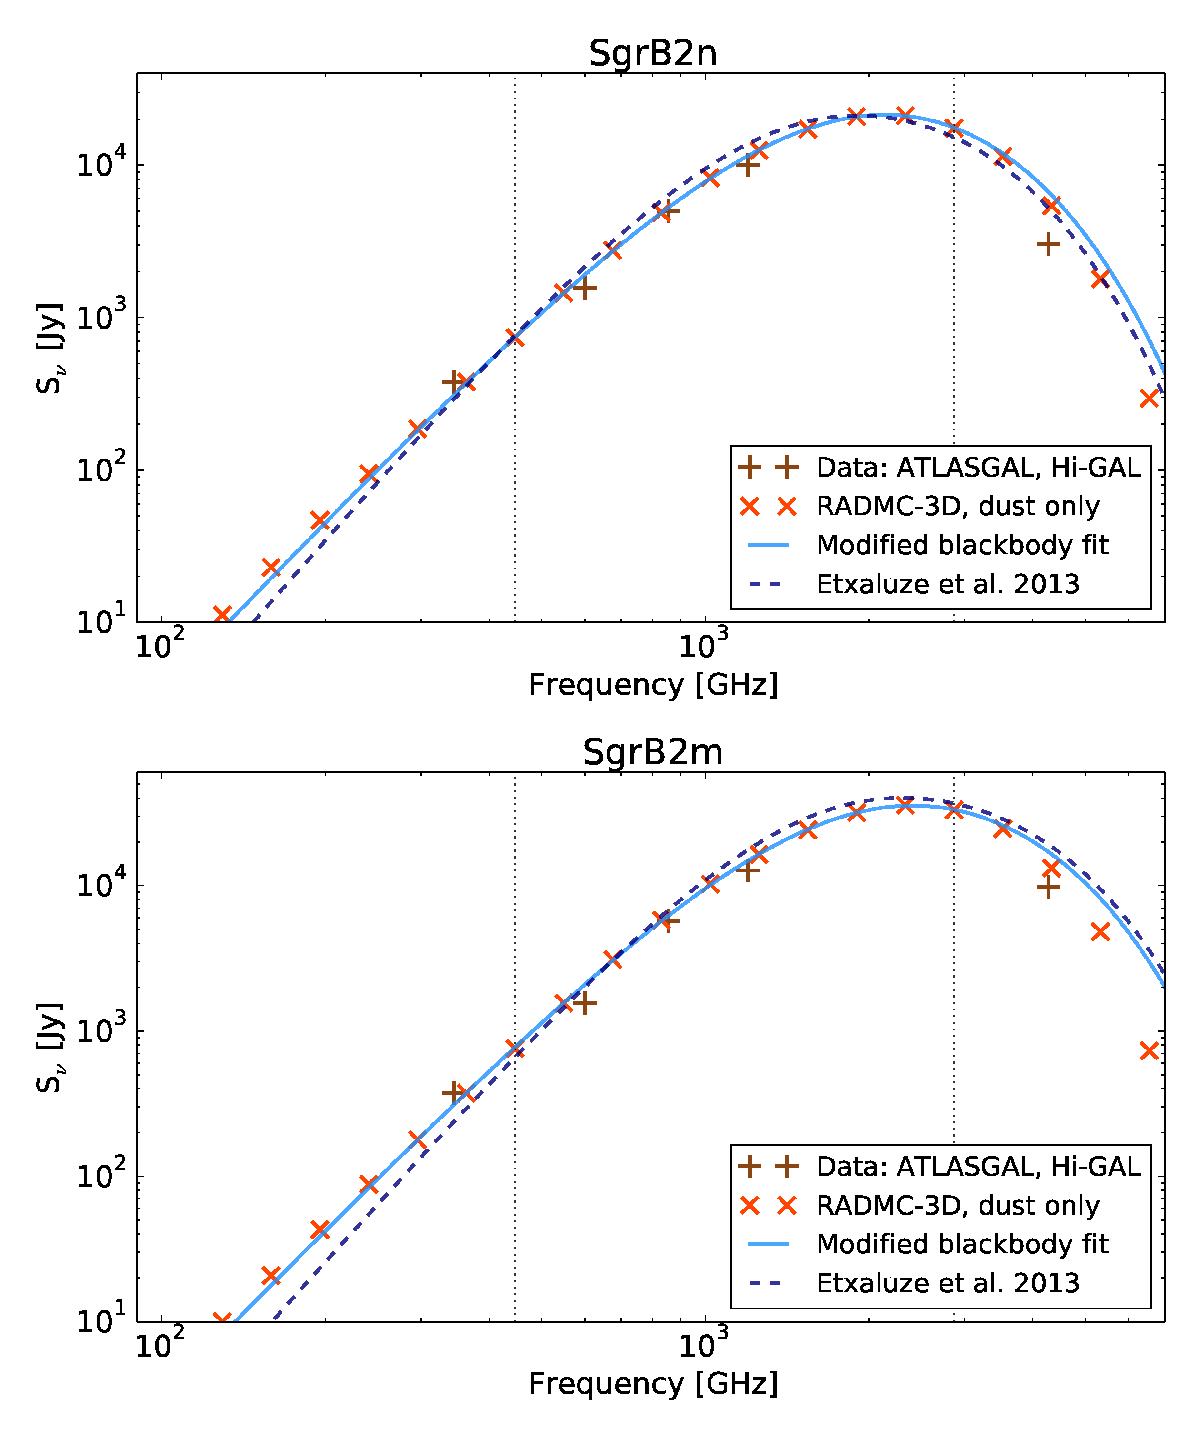
Spectral energy distribution from the modified blackbody fitting for a beamsize of 40′′ . The brown pluses represent the observed flux densities obtained from the ATLASGAL and Hi-GAL maps. The orange markers are the flux densities obtained with RADMC-3D including only dust. The solid blue line is the fitted SED and the dotted blue line is the SED from Etxaluze et al. (2013). Top: Sgr B2(N), bottom: Sgr B2(M).
Current usage metrics show cumulative count of Article Views (full-text article views including HTML views, PDF and ePub downloads, according to the available data) and Abstracts Views on Vision4Press platform.
Data correspond to usage on the plateform after 2015. The current usage metrics is available 48-96 hours after online publication and is updated daily on week days.
Initial download of the metrics may take a while.