Fig. 14
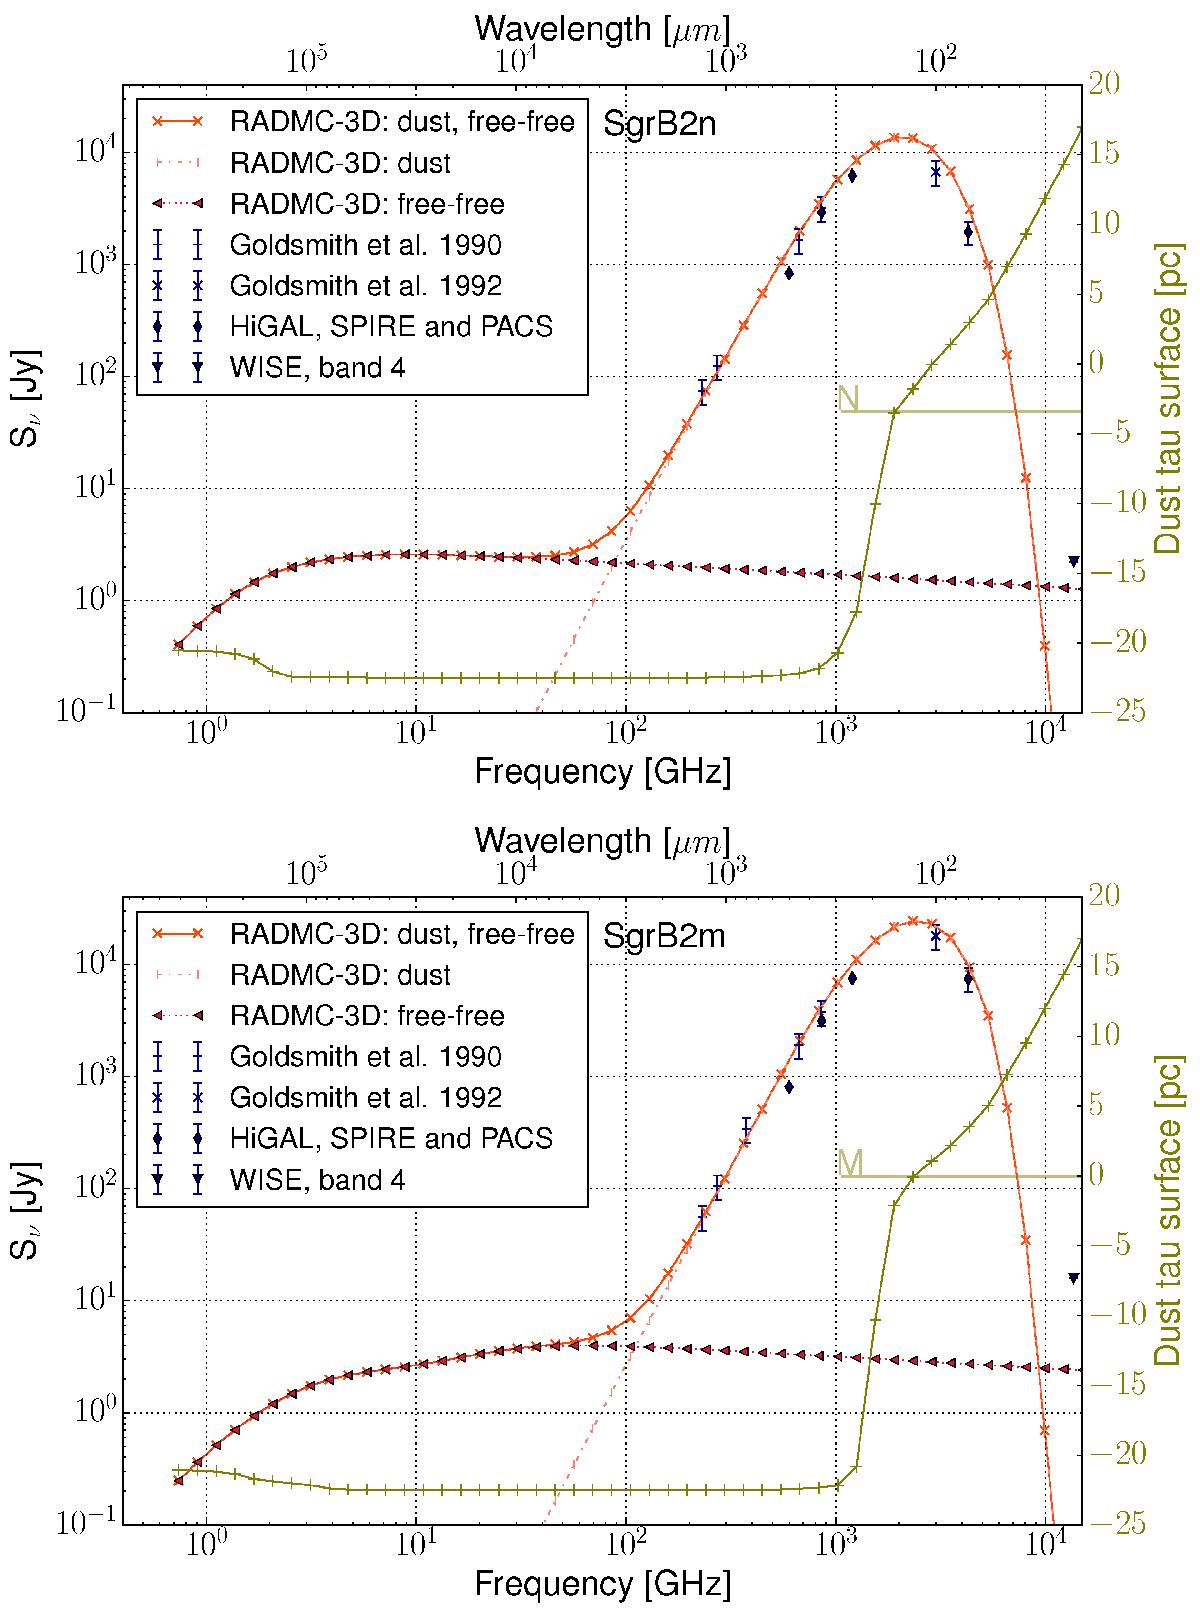
Spectral energy distribution plots using a fixed beamsize of 30′′ . The orange solid line is the RADMC-3D dust and free-free best fit, the orange dotted line represents the free-free contribution, the dashed-dotted line represents the contribution from dust emission. The different dark blue markers represent the observational results from Goldsmith et al. (1990, 1992), as well as from Hi-GAL and WISE maps. The surface, where the dust optical depth equals one is plotted in olive, the corresponding axis is shown on the right. The z-axis points towards the observer, Sgr B2(M) is located at z = 0 and Sgr B2(N) is located at z = 7 × 10⁵ au. A tau surface datapoint at −22.5 pc indicates that the dust is optically thin at the corresponding frequency.
Current usage metrics show cumulative count of Article Views (full-text article views including HTML views, PDF and ePub downloads, according to the available data) and Abstracts Views on Vision4Press platform.
Data correspond to usage on the plateform after 2015. The current usage metrics is available 48-96 hours after online publication and is updated daily on week days.
Initial download of the metrics may take a while.