Fig. 13
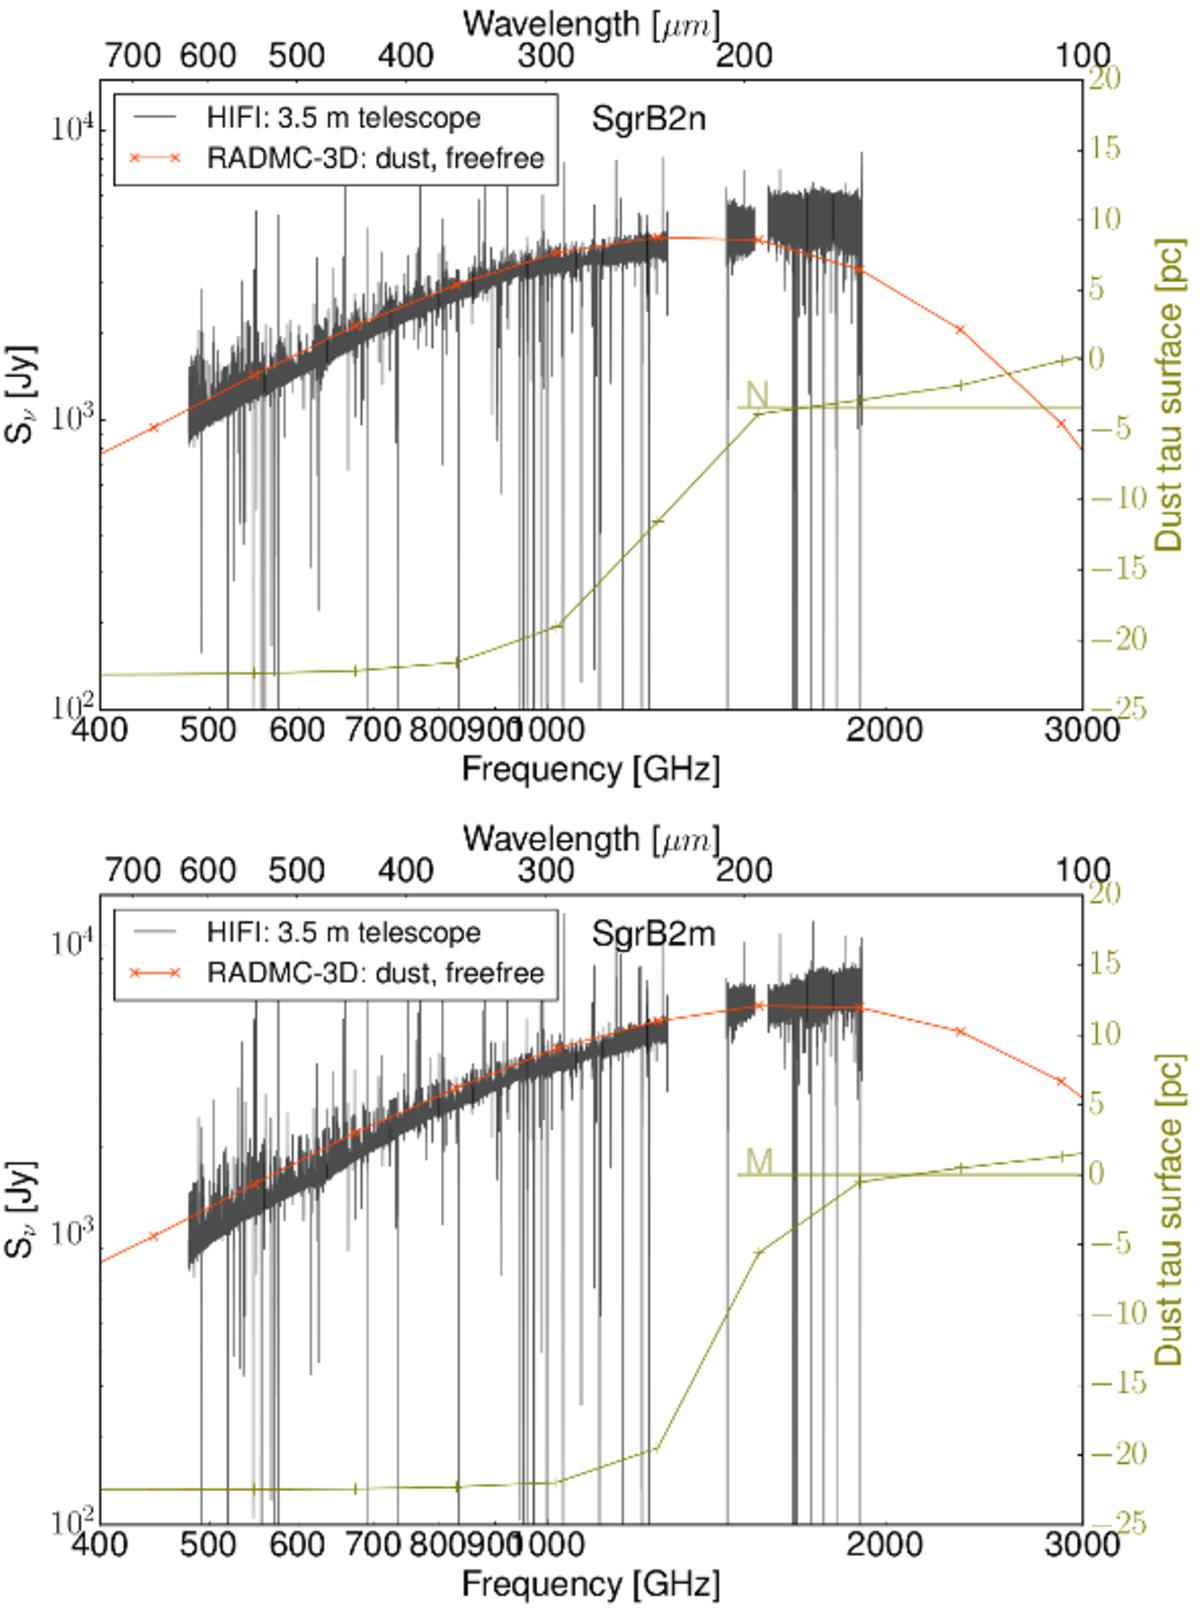
Spectral energy distribution of the HIFI data (in grey). The data is unsmoothed, what looks like noise are actually individual spectral lines. The best fit towards Sgr B2(M) and N are represented by the solid orange line. The synthetic intensity maps have been convolved to the frequency dependent beam of the 3.5 m Herschel telescope. The fit includes dust and free-free emission. The surface, where the dust optical depth equals one is plotted in olive, the corresponding axis is shown on the right. The z-axis points towards the observer, Sgr B2(M) is located at z = 0 and Sgr B2(N) is located at z = 7 × 10⁵ au. A tau surface datapoint at −22.5 pc indicates that the dust is optically thin at the corresponding frequency.
Current usage metrics show cumulative count of Article Views (full-text article views including HTML views, PDF and ePub downloads, according to the available data) and Abstracts Views on Vision4Press platform.
Data correspond to usage on the plateform after 2015. The current usage metrics is available 48-96 hours after online publication and is updated daily on week days.
Initial download of the metrics may take a while.