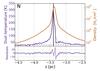
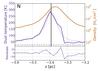
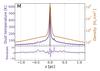
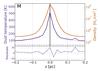
Fig. 10

Density and dust temperature profile along the line-of-sight towards the two hot cores Sgr B2(N) (top) and Sgr B2(M) (bottom). This is obtained with a pixel resolution of 0.5′′ . The left panels show the profile along 2 pc around the hot cores, whereas the panels on the right show a zoom-in view of the inner 0.4 pc. The solid lines show the resulting distributions when including the star clusters. In addition, we show the temperature profile for the same model but without the extrapolated population of low- and intermediate-mass stars (dotted line). The bottom panel of each plot shows the residuals.
Current usage metrics show cumulative count of Article Views (full-text article views including HTML views, PDF and ePub downloads, according to the available data) and Abstracts Views on Vision4Press platform.
Data correspond to usage on the plateform after 2015. The current usage metrics is available 48-96 hours after online publication and is updated daily on week days.
Initial download of the metrics may take a while.