Fig. 5
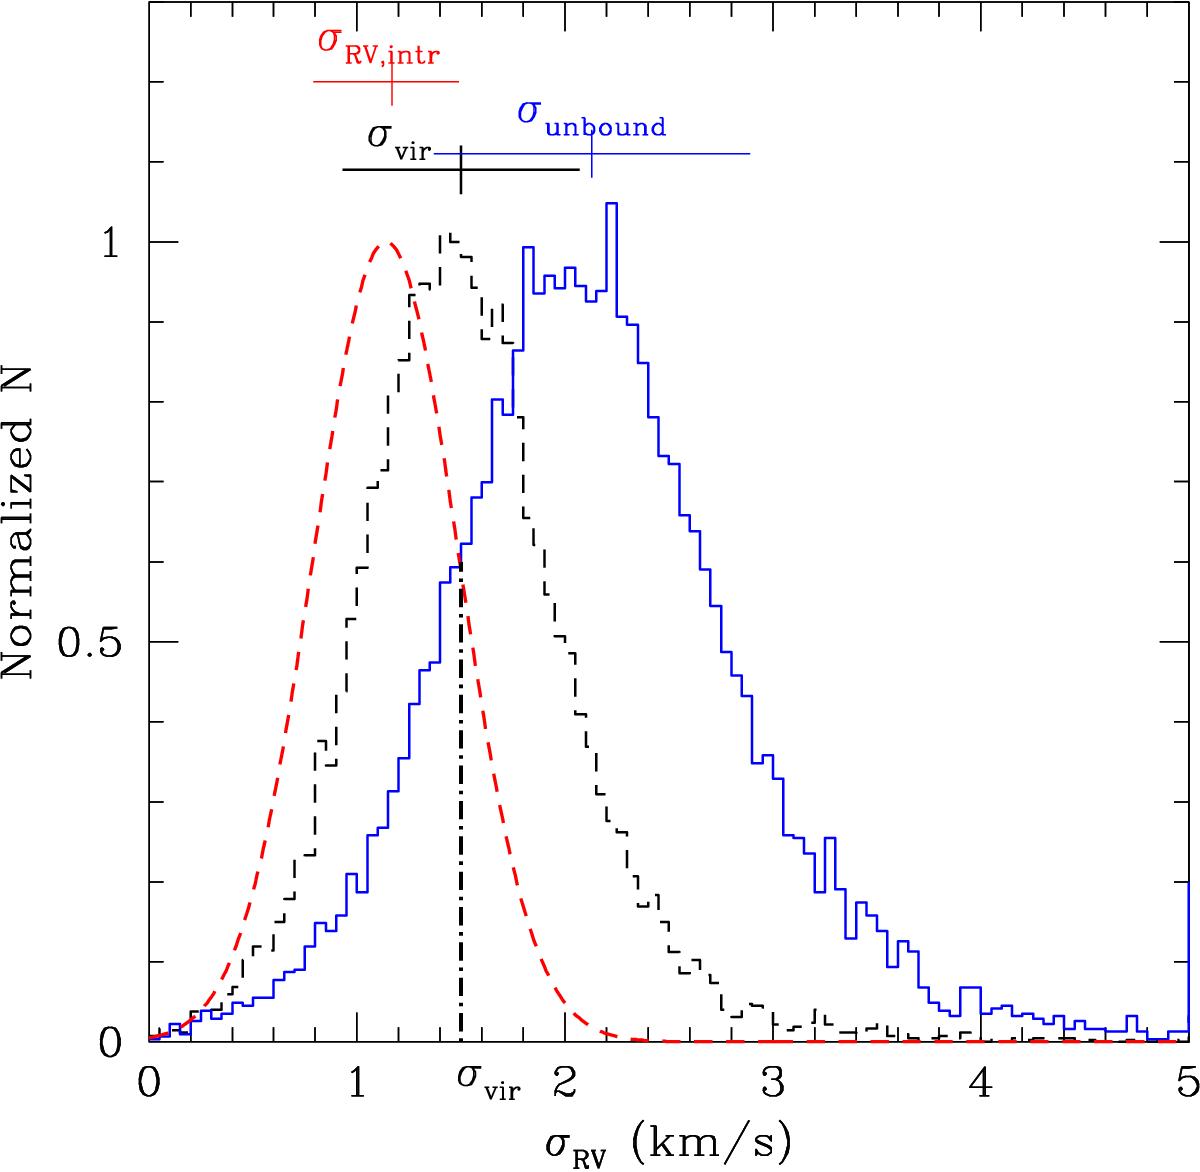
Black dashed histogram represents the distribution of the velocity dispersions obtained from Eq. (1) for 10 000 realizations, when errors on Mdyn and rhm, and the uncertainty on the η parameter are taken into account. The corresponding distribution needed for the cluster to be unbound is shown as a blue histogram. The distribution of the intrinsic radial velocity dispersion for L1688 is shown as a red dashed profile.
Current usage metrics show cumulative count of Article Views (full-text article views including HTML views, PDF and ePub downloads, according to the available data) and Abstracts Views on Vision4Press platform.
Data correspond to usage on the plateform after 2015. The current usage metrics is available 48-96 hours after online publication and is updated daily on week days.
Initial download of the metrics may take a while.