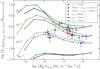
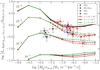
Fig. 8

Line-strength ratio of the cold H2O JKa,Kc = 21,2−10,1 transition and the CO J = 15−14 transition as a function of Ṁg/ ν∞,g. The points with error bars give the measured H2O/CO line-strength ratios, color coded according to the values of ν∞,g (left panel) or according to the variability type (right panel). A black cross superimposed on the data point indicates that the H2O line is flagged as a blend. The black curves show the same predicted H2O/CO line-strength ratios as Fig. 7 with nH2O/nH2 as indicated in the figures, ν∞,g = 10 km s-1 and ψ = 1 × 10⁻³. In the left panel, the green curves show the predicted H2O/CO line-strength ratios for ν∞,g = 25 km s-1. In the right panel, predictions for ψ = 0.5 × 10⁻³ in red and ψ = 2 × 10⁻³ in green are shown. Adopted values for other parameters are listed in Table 4.
Current usage metrics show cumulative count of Article Views (full-text article views including HTML views, PDF and ePub downloads, according to the available data) and Abstracts Views on Vision4Press platform.
Data correspond to usage on the plateform after 2015. The current usage metrics is available 48-96 hours after online publication and is updated daily on week days.
Initial download of the metrics may take a while.