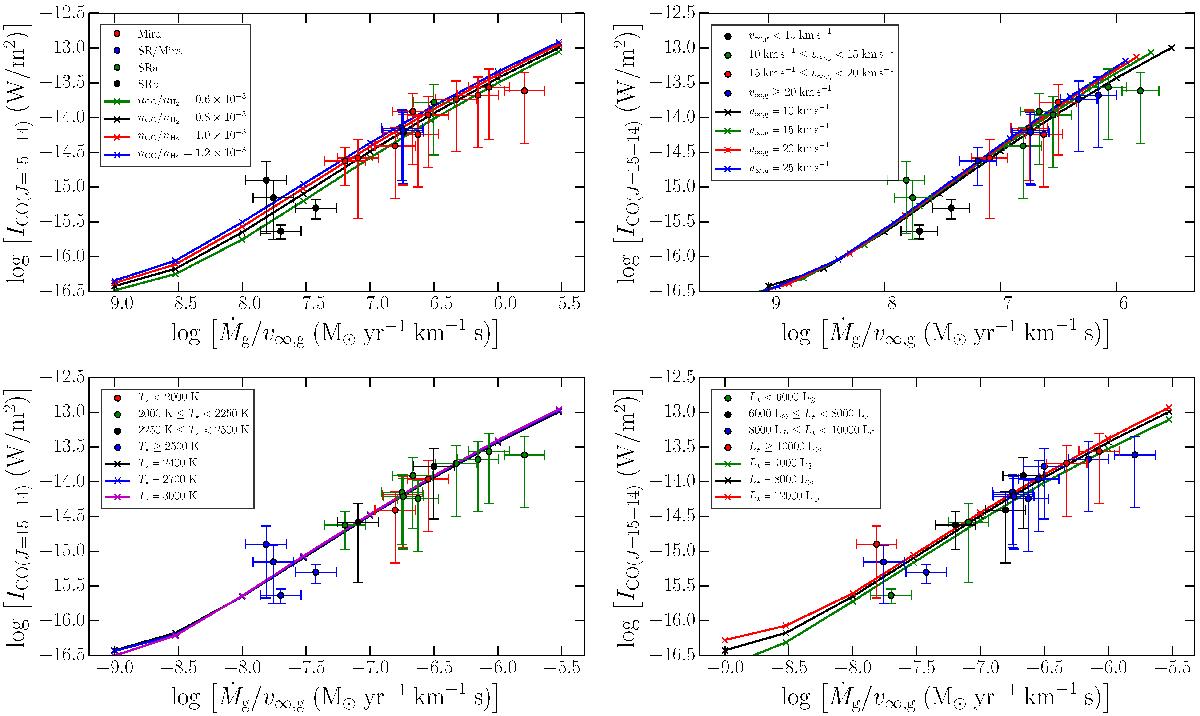
Fig. 6

Line strengths of the CO J = 15−14 transition as a function of Ṁg/ ν∞,g. The points with error bars give the measured CO line strengths, color coded according to the pulsational type or according to the values of the relevant quantity indicated in the legend. Each panel shows curves for different values of a given parameter in the model grid with similar color coding as the data points, if applicable: the CO abundance with respect to H2 (nCO/nH2; upper left panel), gas terminal velocity (ν∞,g; upper right panel), stellar effective temperature (T⋆; lower left panel), and stellar luminosity (L⋆; lower right panel). Adopted values for other parameters are listed in Table 4. The line strengths are scaled to a distance of 100 pc.
Current usage metrics show cumulative count of Article Views (full-text article views including HTML views, PDF and ePub downloads, according to the available data) and Abstracts Views on Vision4Press platform.
Data correspond to usage on the plateform after 2015. The current usage metrics is available 48-96 hours after online publication and is updated daily on week days.
Initial download of the metrics may take a while.


