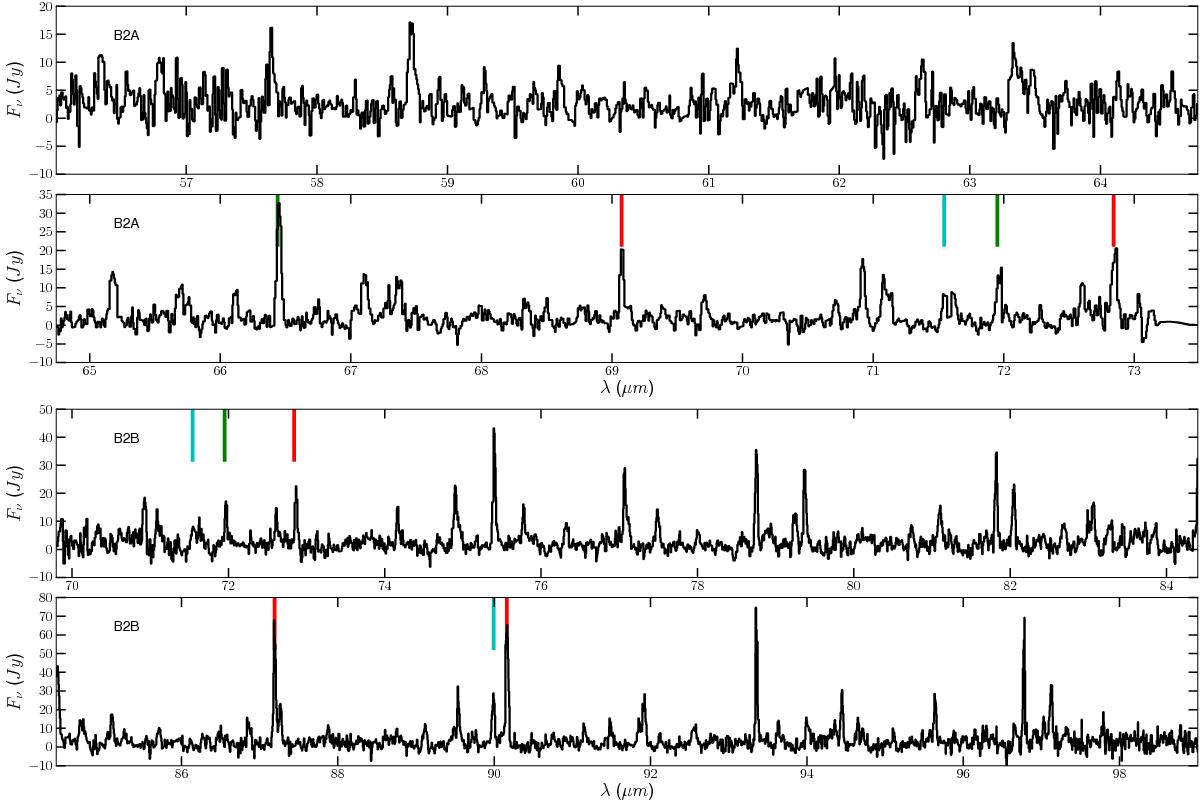
Fig. B.1

Continuum-subtracted PACS spectrum of RW LMi is shown in black for the blue bands. The vertical lines indicate molecular identifications according to Table B.1: CO in red, 13CO in magenta, ortho-H2O in green, and para-H2O in cyan. If a black dashed line is superimposed over the identification line, the transition was not detected by our line-fitting algorithm. Lines have been indicated only if they occur in the wavelength ranges shared with the OT2 line scans (indicated in red in Table B.1) because the other identifications are less reliable (see Sect. 2.3). The PACS band is indicated in the upper left corner of each spectrum.
Current usage metrics show cumulative count of Article Views (full-text article views including HTML views, PDF and ePub downloads, according to the available data) and Abstracts Views on Vision4Press platform.
Data correspond to usage on the plateform after 2015. The current usage metrics is available 48-96 hours after online publication and is updated daily on week days.
Initial download of the metrics may take a while.


