Fig. 4
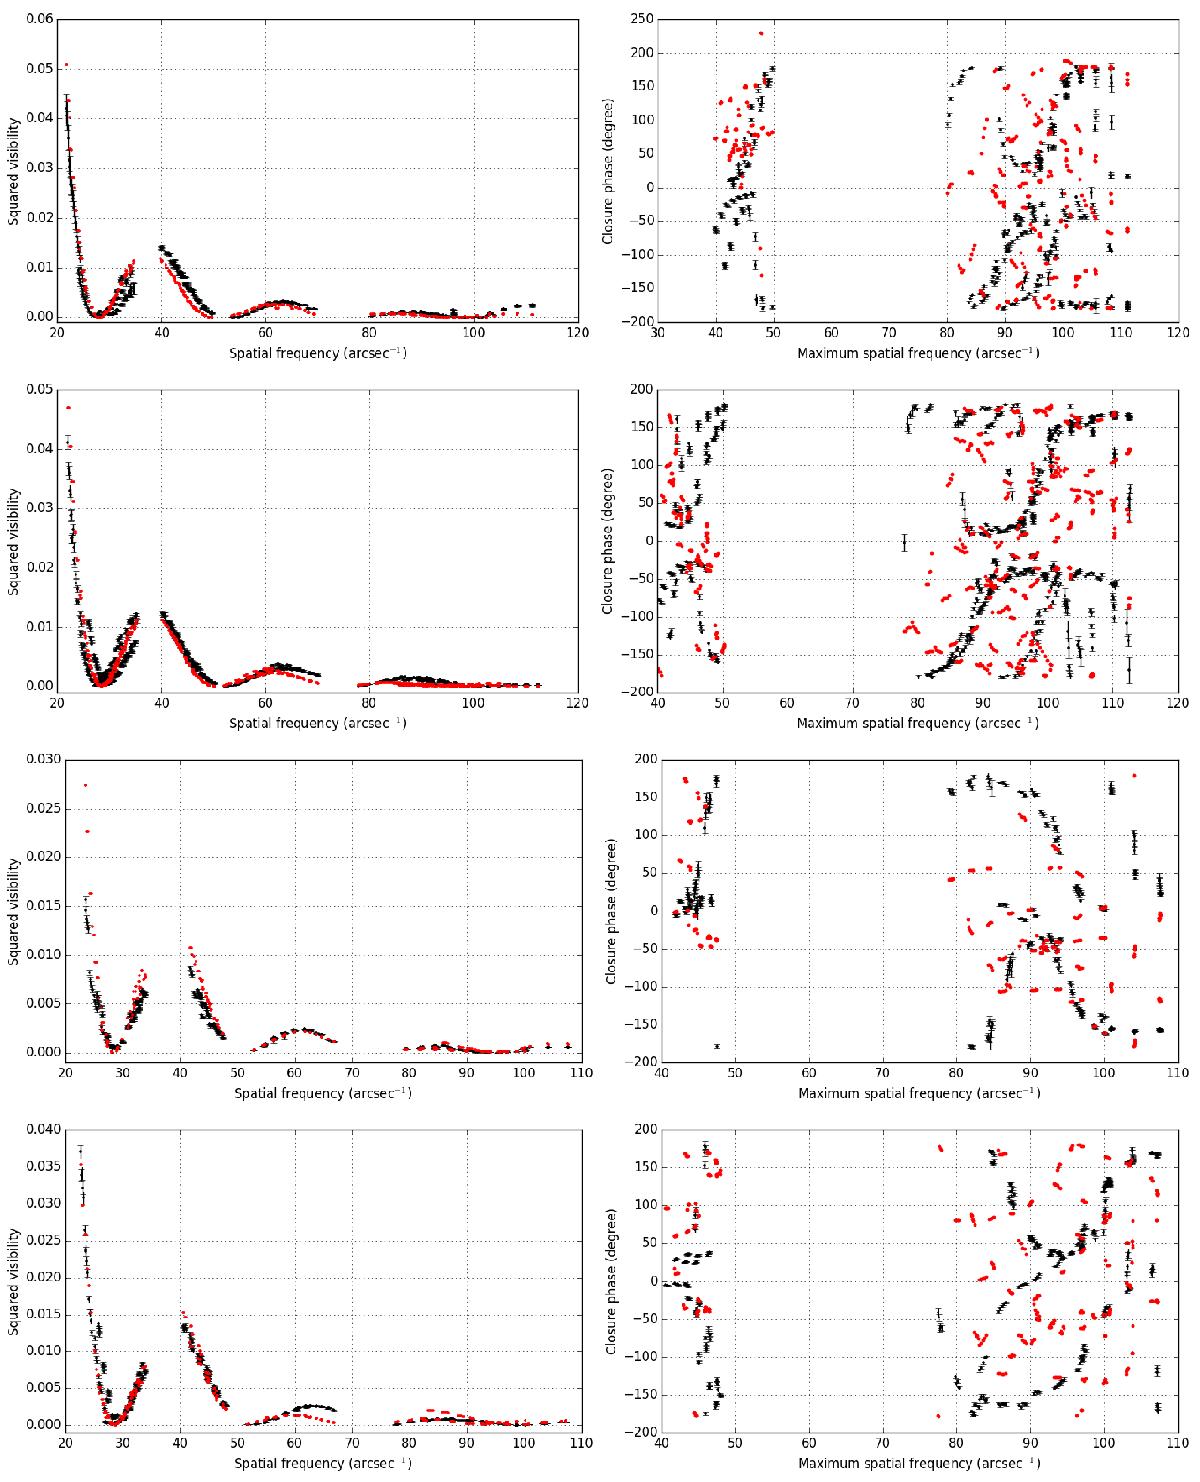
Comparison of the squared visibilities (left) and closure phases (right) of the VLTI/PIONIER data in black and the best snapshot of the RHD simulation in red for each epoch. Only spatial frequencies greater than 51 arcsec-1 were considered. Only the visibilities are fitted. The four rows corresponds to the 2012 January epoch (first row), 2013 February epoch (second row), 2014 January epoch (third row), and 2014 November epoch (fourth row).
Current usage metrics show cumulative count of Article Views (full-text article views including HTML views, PDF and ePub downloads, according to the available data) and Abstracts Views on Vision4Press platform.
Data correspond to usage on the plateform after 2015. The current usage metrics is available 48-96 hours after online publication and is updated daily on week days.
Initial download of the metrics may take a while.