Fig. 1
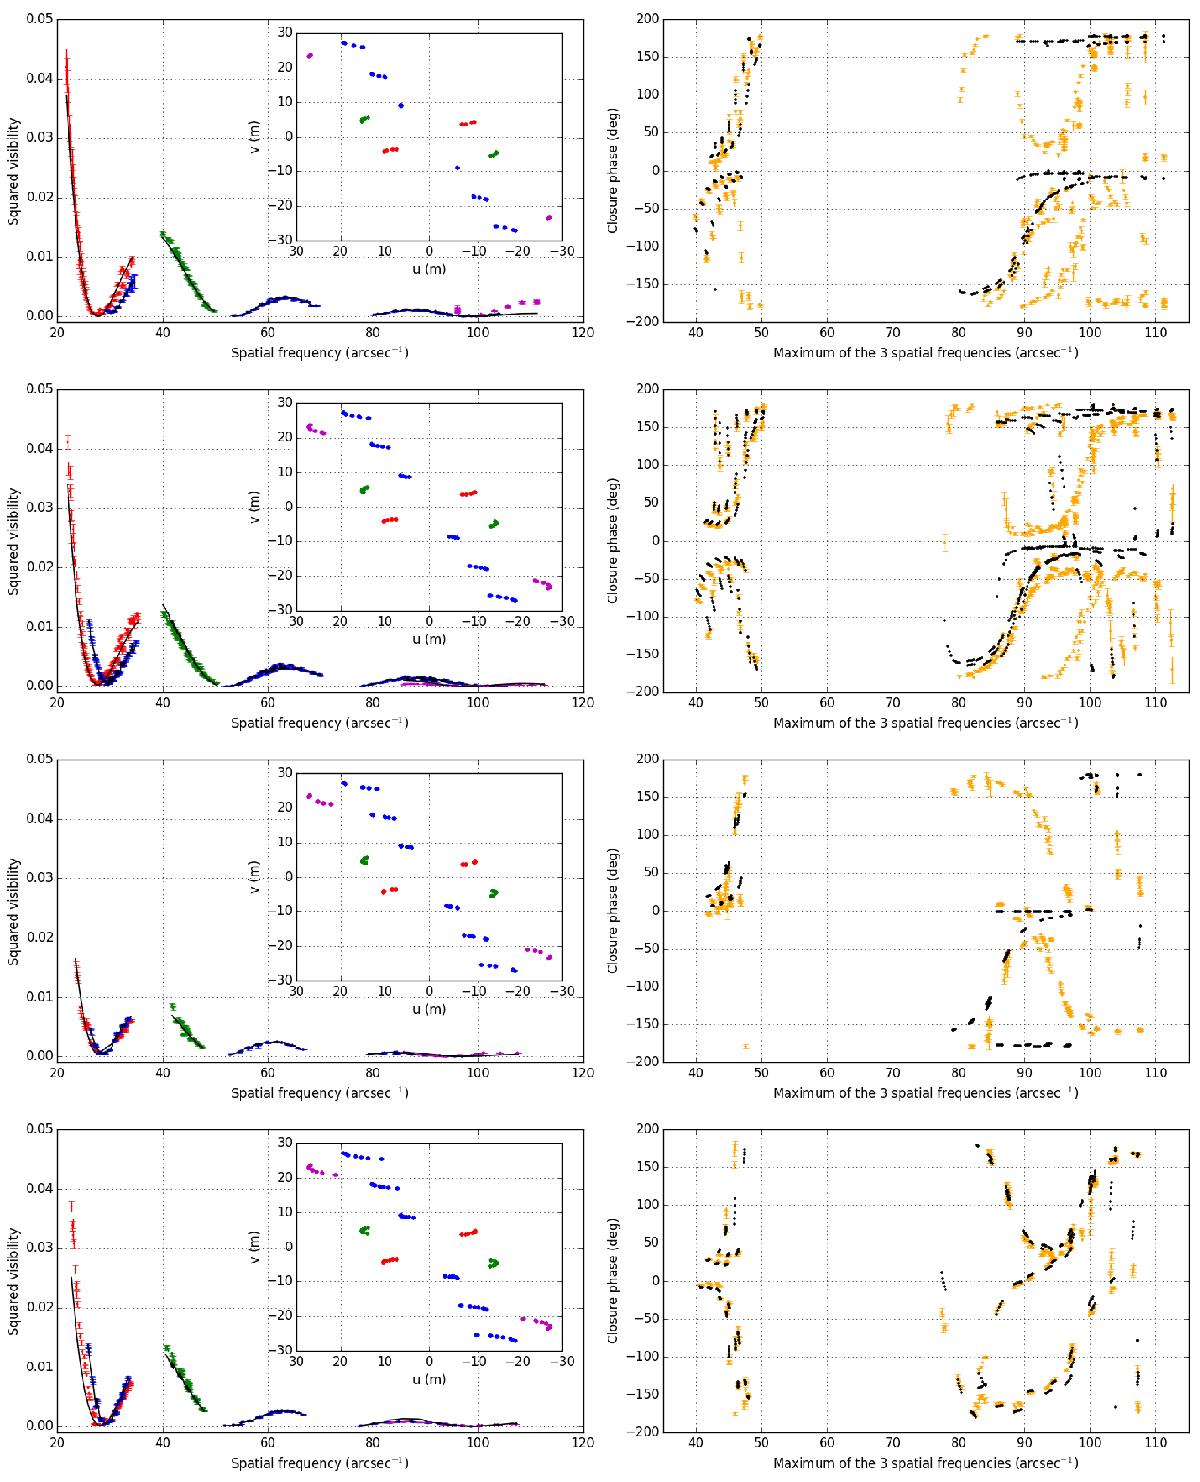
Fit of the PIONIER data by the LDD and hotspot model. Only spatial frequencies lower than 51 arcsec-1 were considered. Insets in the left column: PA color-coded (u,v) coverage. North is up and East is left. Left column: squared visibilities with matching colors. Right column: closure phases. The best-fitted model is represented in black. The four rows correpond to the 2012 January epoch (first row), 2013 February epoch (second row), 2014 January epoch (third row), and 2014 November epoch (fourth row). For this latter epoch, a two-spots model was used and the whole spatial frequency range was considered.
Current usage metrics show cumulative count of Article Views (full-text article views including HTML views, PDF and ePub downloads, according to the available data) and Abstracts Views on Vision4Press platform.
Data correspond to usage on the plateform after 2015. The current usage metrics is available 48-96 hours after online publication and is updated daily on week days.
Initial download of the metrics may take a while.