Fig. 5
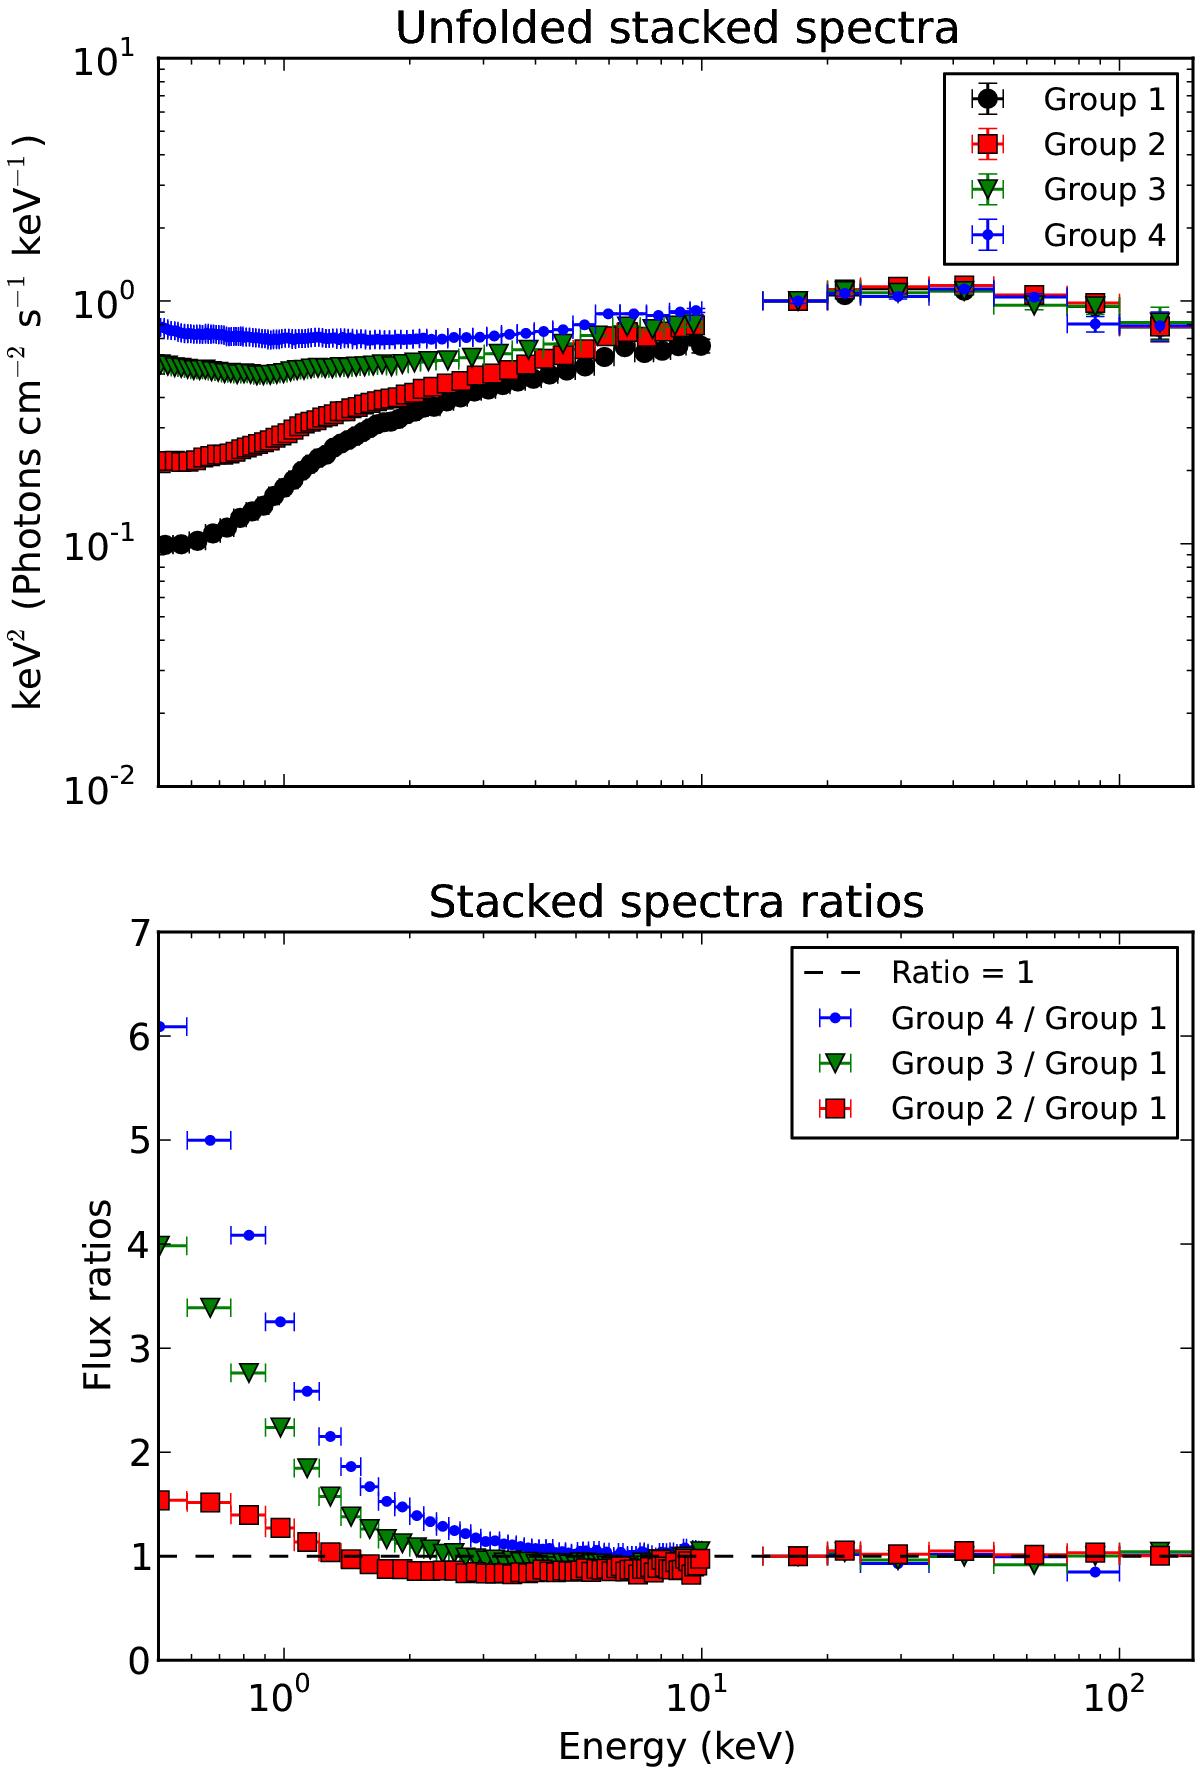
Results of stacking spectra per soft-excess strengths. Top panel: unfolded stacked XMM-Newton/PN and Swift/BAT spectra for the four groups of different q (normalized to the spectrum with a lower q value, at 15 keV). The q value is increasing for stacked spectra from black circles (Group 1) to red squares (Group 2), to green triangles (Group 3) and to blue dots (Group 4). Bottom panel: ratios of the stacked XMM-Newton/PN and Swift/BAT spectra. The ratio of stacked spectra of higher q (Group 4) over lower q (Group 1) is represented in blue points. The ratio of stacked spectra from Group 3 over Group 1 is plotted in green triangles. The ratio of Group 2 over Group 1 is in red squares.
Current usage metrics show cumulative count of Article Views (full-text article views including HTML views, PDF and ePub downloads, according to the available data) and Abstracts Views on Vision4Press platform.
Data correspond to usage on the plateform after 2015. The current usage metrics is available 48-96 hours after online publication and is updated daily on week days.
Initial download of the metrics may take a while.