Free Access
Fig. 4
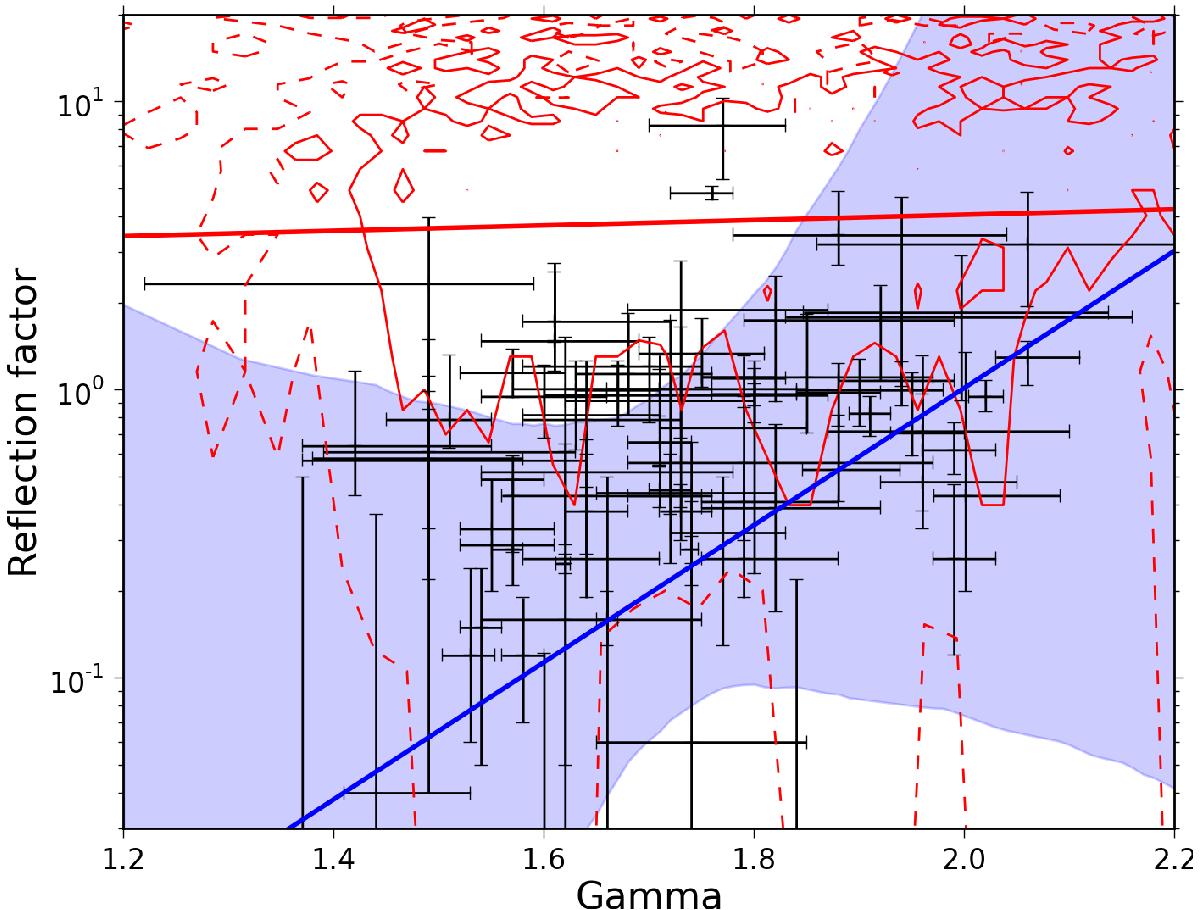
Reflection factor against the power-law slope obtained with XMM-Newton and BAT data (in the case of distant reflection). CI is represented by the blue contour. The red line represents the relation between R and Γ in the case of ionized reflection. Density contours are plotted in red (solid line: 68%, dashed line: 90%).
Current usage metrics show cumulative count of Article Views (full-text article views including HTML views, PDF and ePub downloads, according to the available data) and Abstracts Views on Vision4Press platform.
Data correspond to usage on the plateform after 2015. The current usage metrics is available 48-96 hours after online publication and is updated daily on week days.
Initial download of the metrics may take a while.