Fig. 2
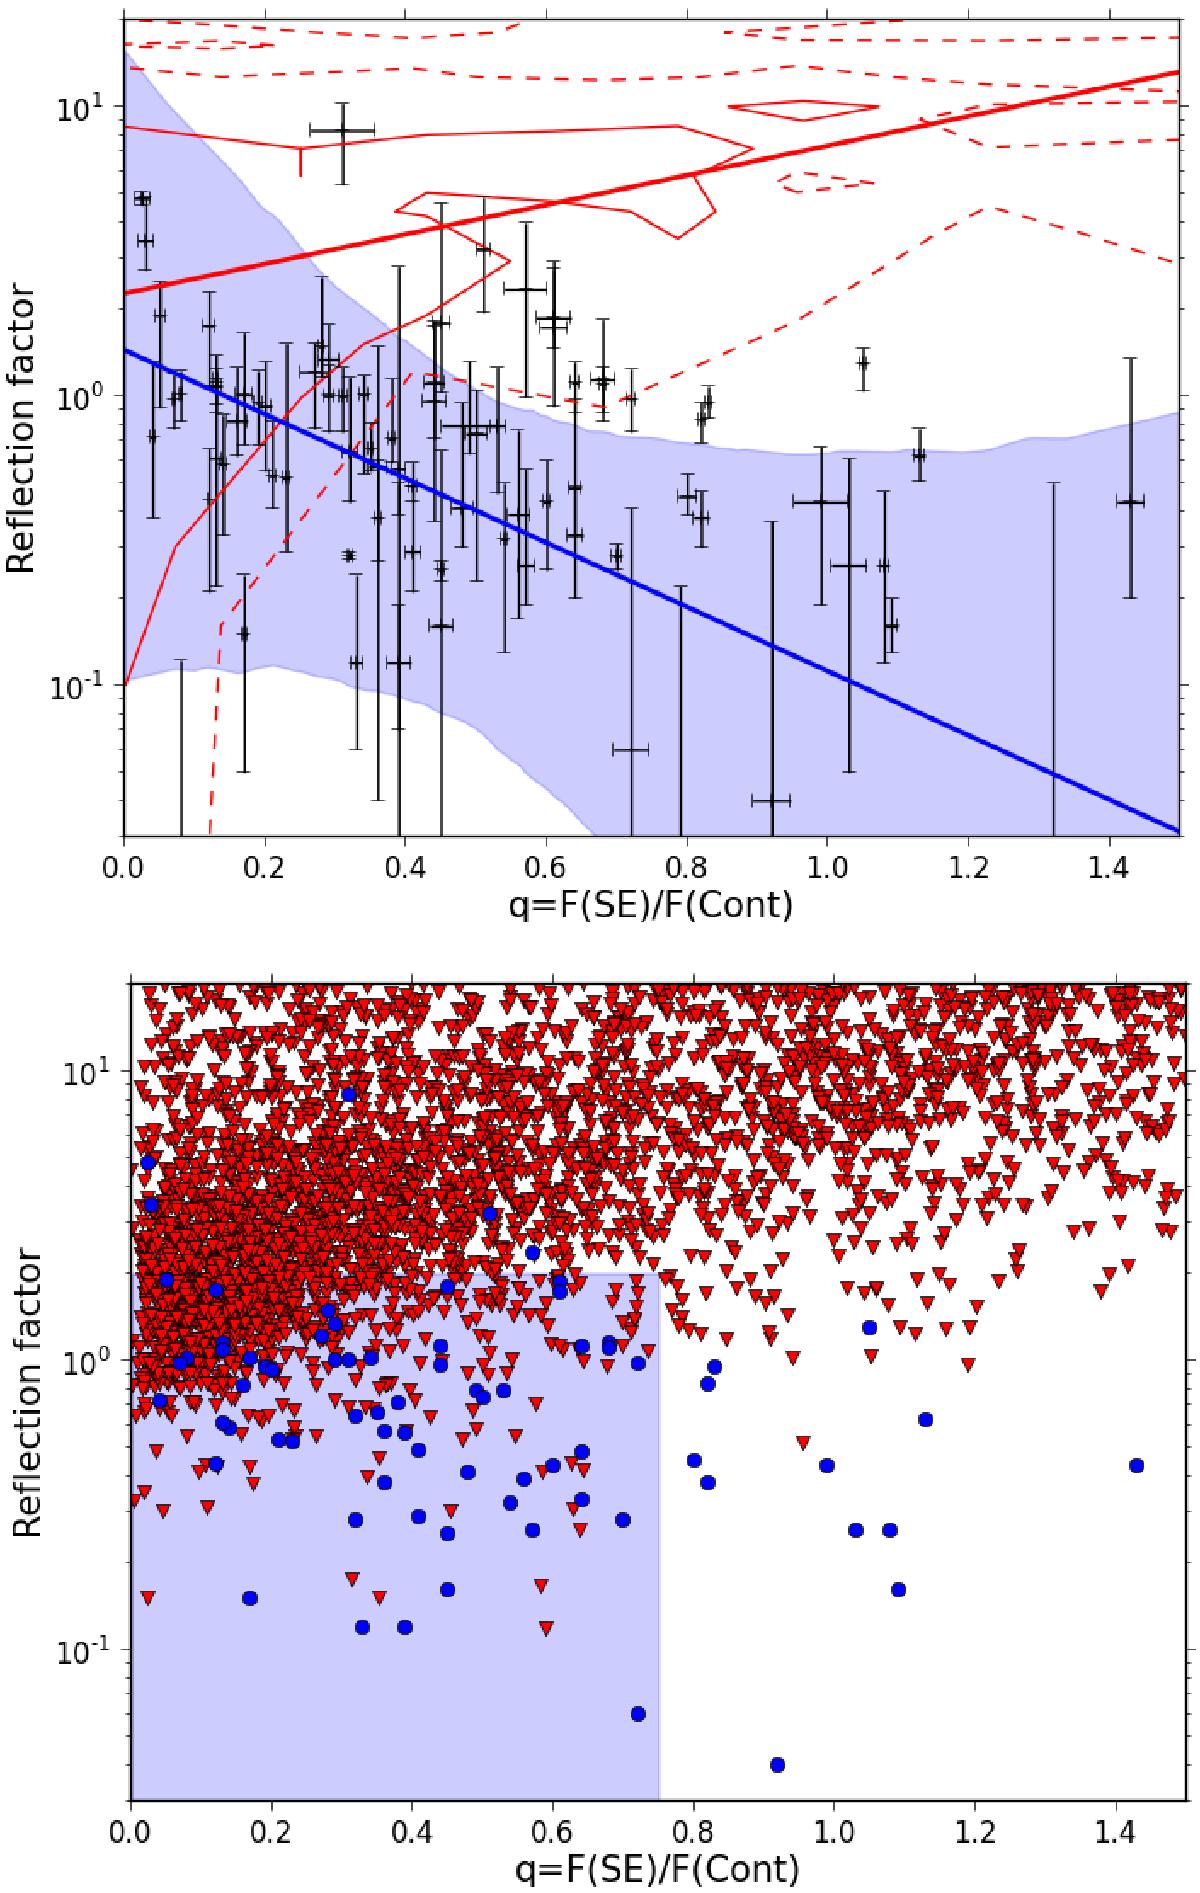
Reflection factor R as a function of the strength of the soft excess q (in the case of distant reflection). Top panel: linear regression performed using the linmix_err procedure is represented by the blue line, and 99.9% CI is given by the blue contour. The red line represents the positive correlation expected if the soft excess is due to ionized reflection (result of relxilllp_ion simulations, see Sect. 4.2). Density contours of the simulations are plotted in red (solid line: 68%; dashed line: 90%). Bottom panel: blue points represent our 79 objects showing a soft excess. They are mostly contained (75%) in the blue box (R< 2.0 and q< 0.75). Red triangles are relxilllp_ion simulation results.
Current usage metrics show cumulative count of Article Views (full-text article views including HTML views, PDF and ePub downloads, according to the available data) and Abstracts Views on Vision4Press platform.
Data correspond to usage on the plateform after 2015. The current usage metrics is available 48-96 hours after online publication and is updated daily on week days.
Initial download of the metrics may take a while.