Free Access
Fig. 1
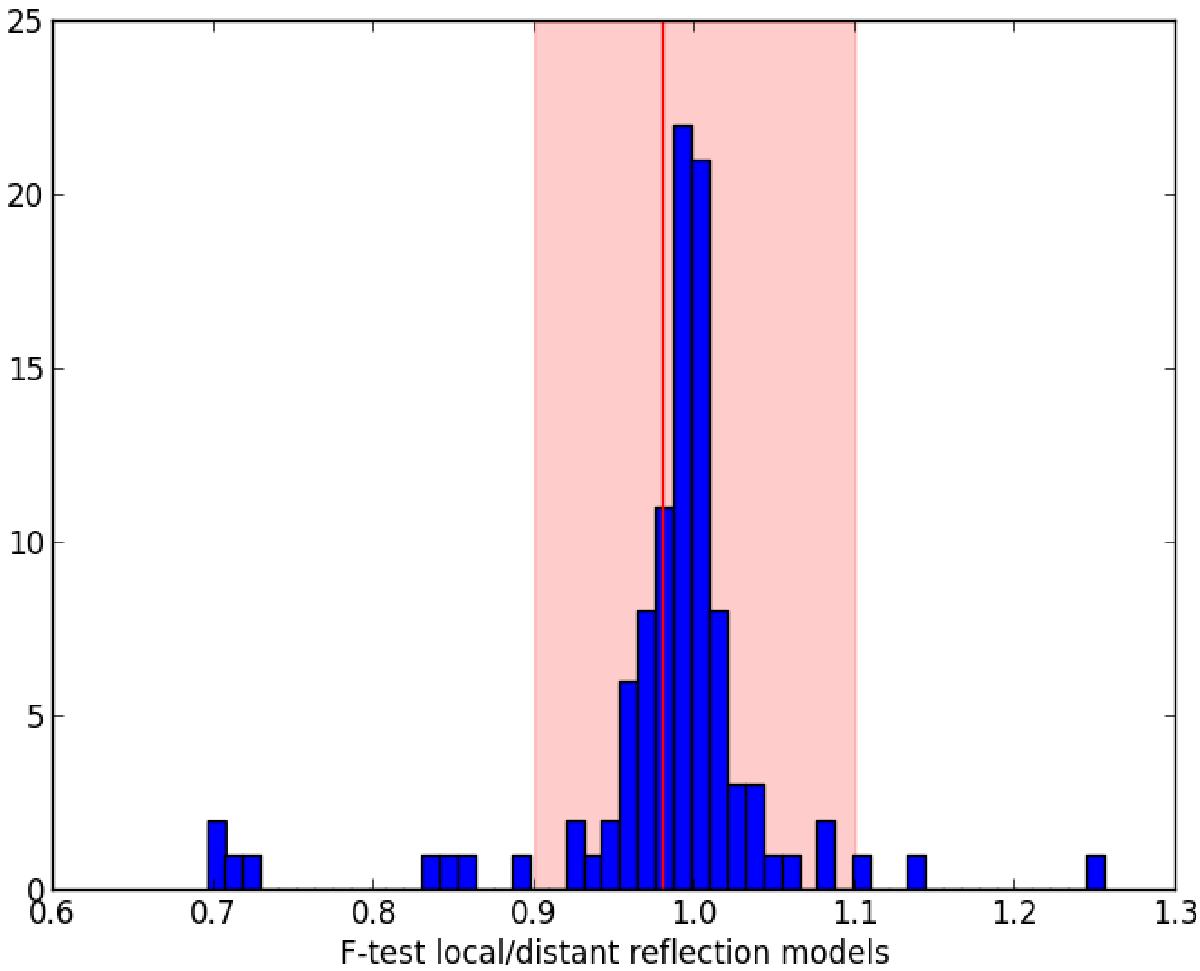
Distribution of the F test results between the local reflection model and the distant reflection model used to fit each object. The red area is the acceptance zone of the null hypothesis. The average F value, represented by the red line, is inside the acceptance zone.
Current usage metrics show cumulative count of Article Views (full-text article views including HTML views, PDF and ePub downloads, according to the available data) and Abstracts Views on Vision4Press platform.
Data correspond to usage on the plateform after 2015. The current usage metrics is available 48-96 hours after online publication and is updated daily on week days.
Initial download of the metrics may take a while.