Fig. 9
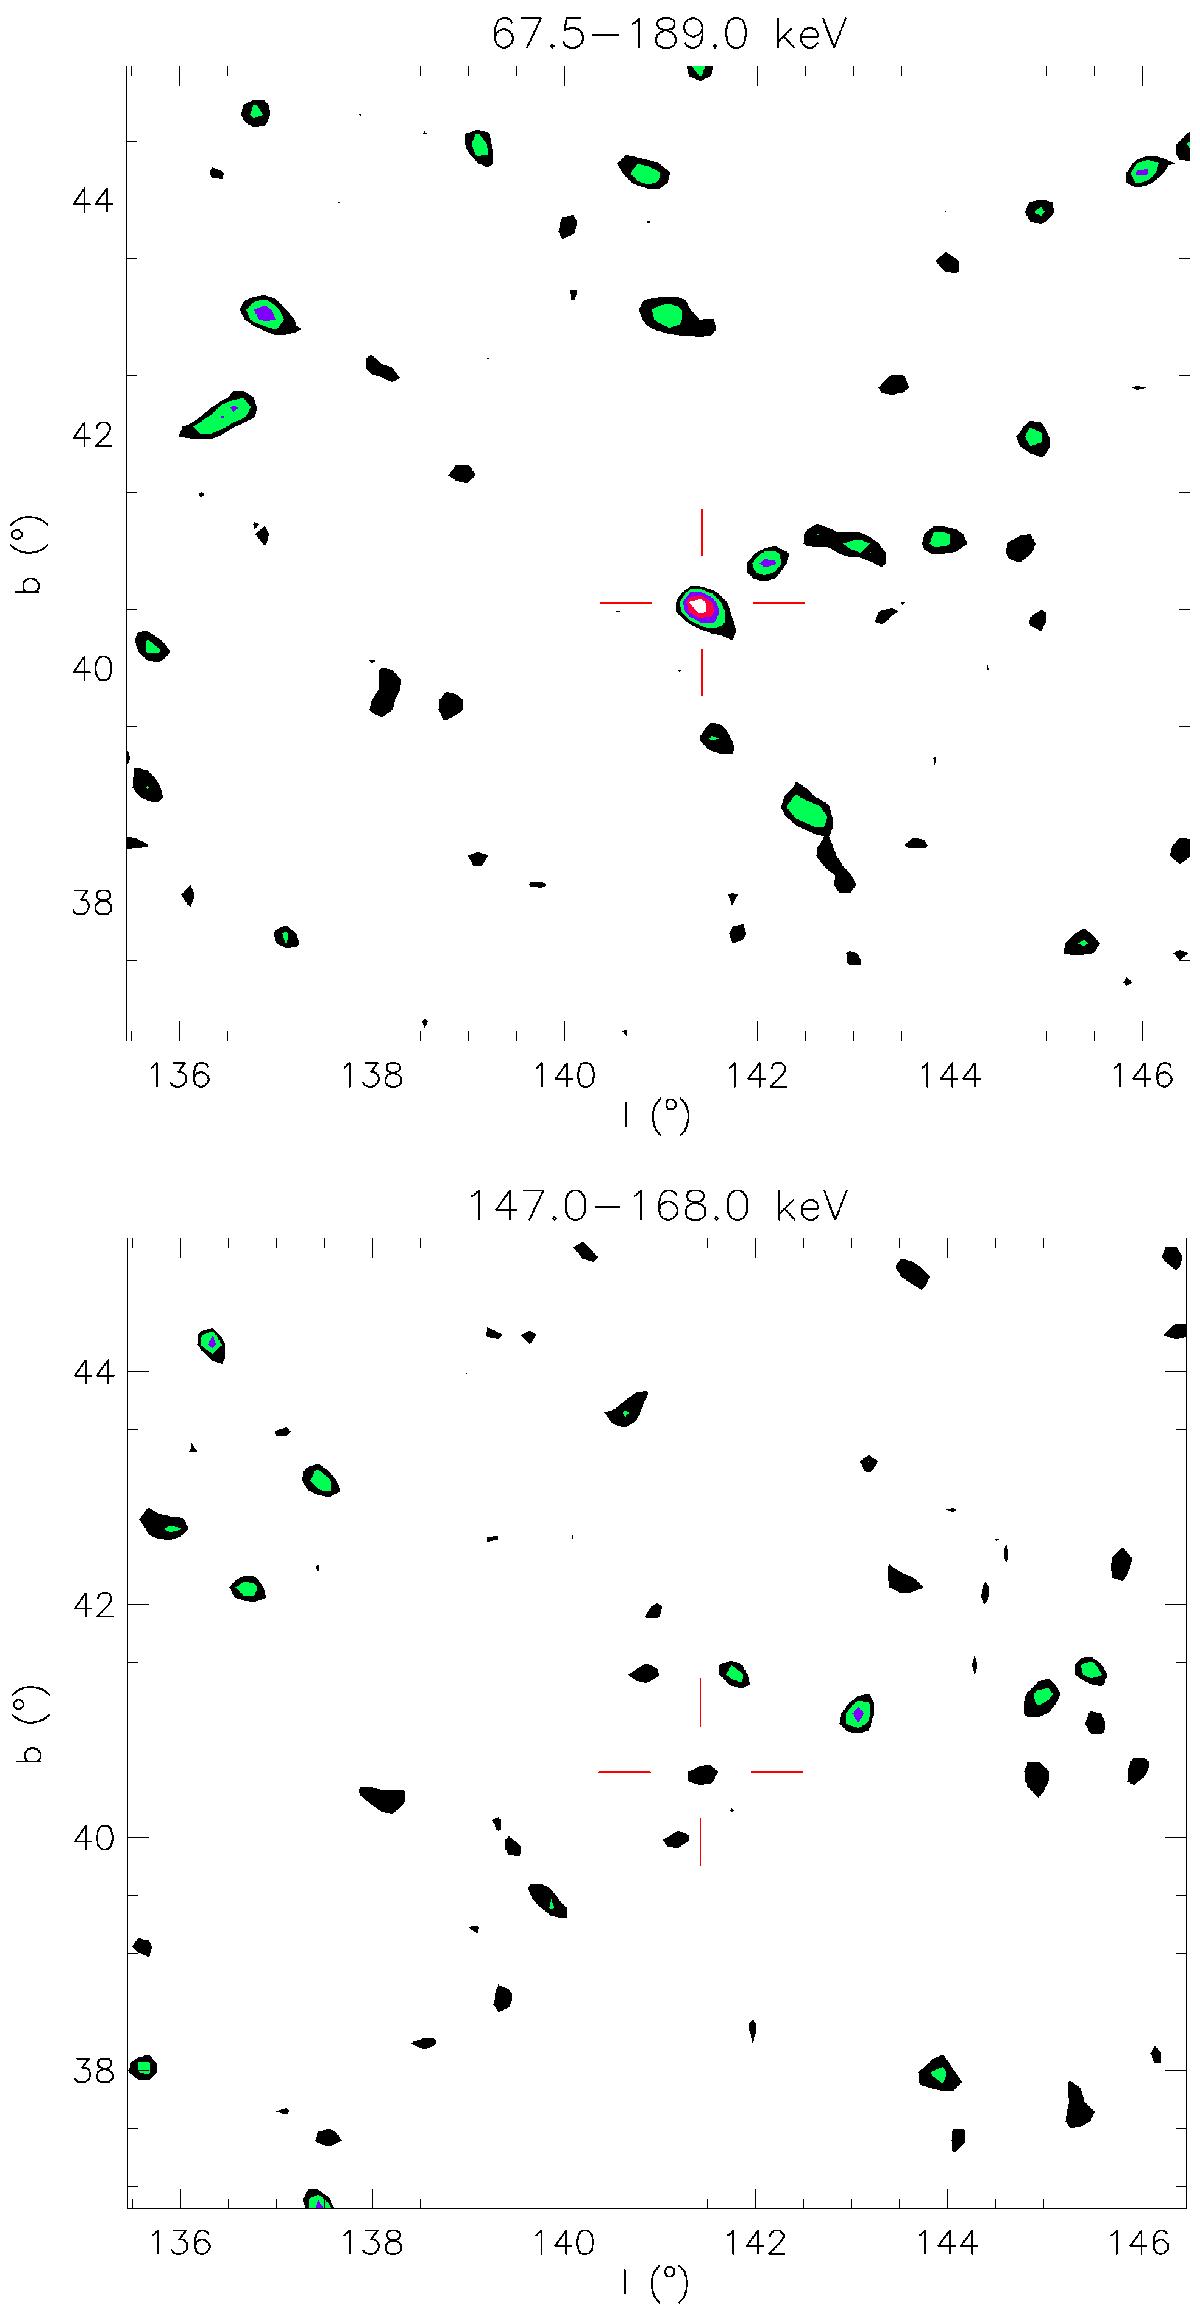
Gamma-ray signature in the IBIS/ISGRI data. The figure displays the IBIS/ISGRI significance contour map in the 67.5−189 keV band (upper panel) and in the 147−168 keV band (lower panel) for the entire early period (days 16−35 after the explosion). The contours start at the 2σ level and are separated by 0.5σ. The average flux in the upper panel at the position of SN2014J represents a 5.4σ excess after normalization on the standard deviation observed in this map.
Current usage metrics show cumulative count of Article Views (full-text article views including HTML views, PDF and ePub downloads, according to the available data) and Abstracts Views on Vision4Press platform.
Data correspond to usage on the plateform after 2015. The current usage metrics is available 48-96 hours after online publication and is updated daily on week days.
Initial download of the metrics may take a while.