Free Access
Fig. 8
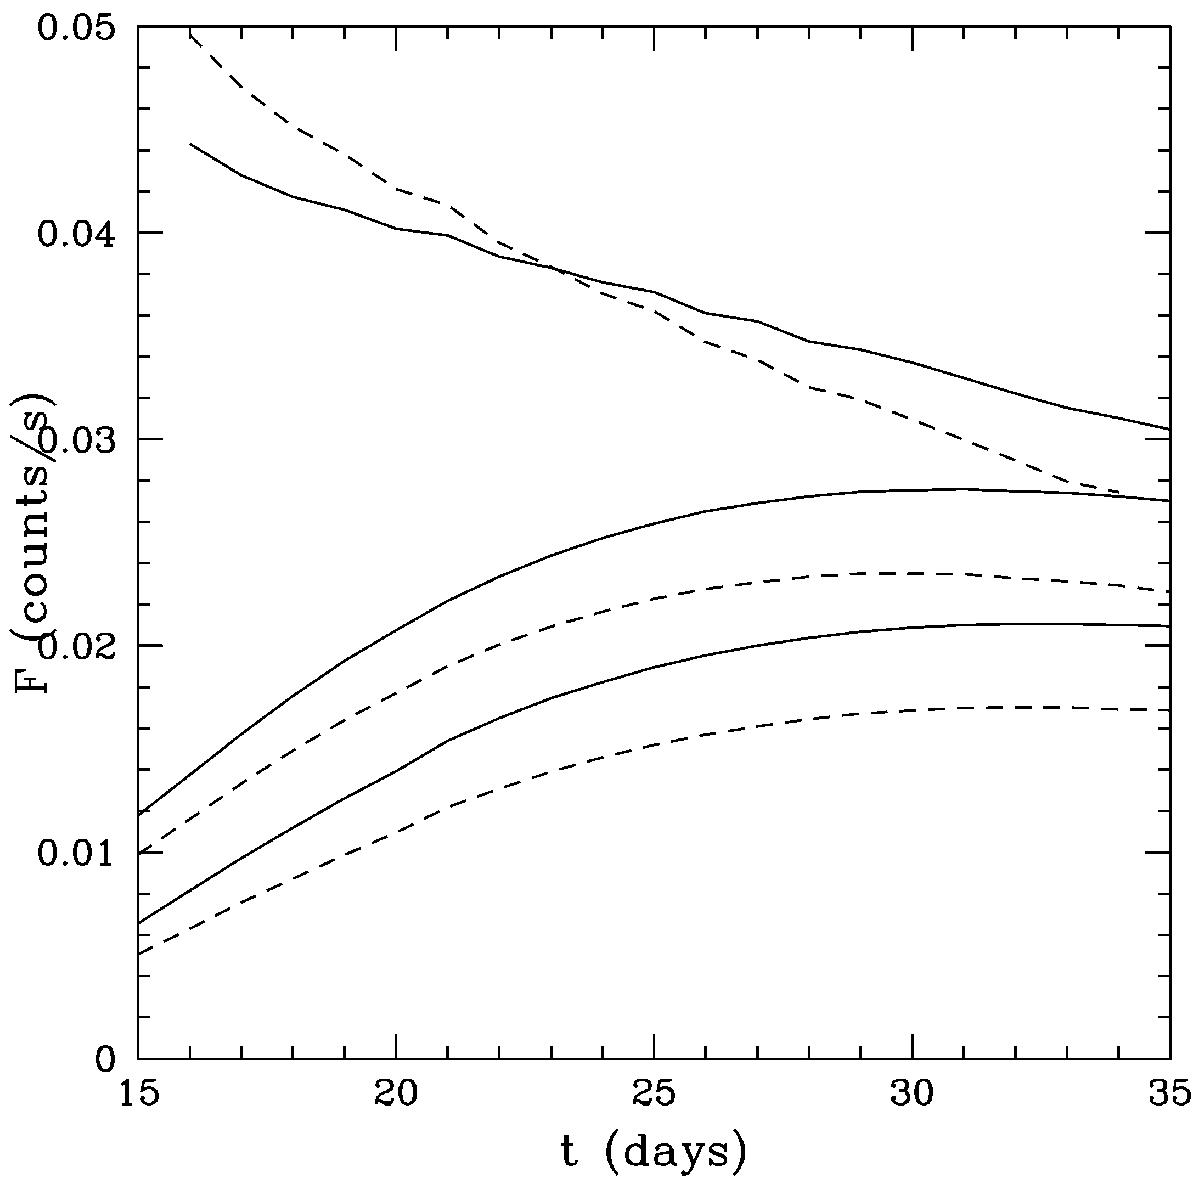
IBIS/ISGRI light curve in response to different spectral models. Dashed lines represent the temporal evolution of the 144.5−168 keV band of the 3Dbball, DDT1p4, and W7 models (from top to bottom) multiplied by the effective area in this band (370 cm2). Continuous lines represent their convolution with the ISGRI response.
Current usage metrics show cumulative count of Article Views (full-text article views including HTML views, PDF and ePub downloads, according to the available data) and Abstracts Views on Vision4Press platform.
Data correspond to usage on the plateform after 2015. The current usage metrics is available 48-96 hours after online publication and is updated daily on week days.
Initial download of the metrics may take a while.