Free Access
Fig. 7
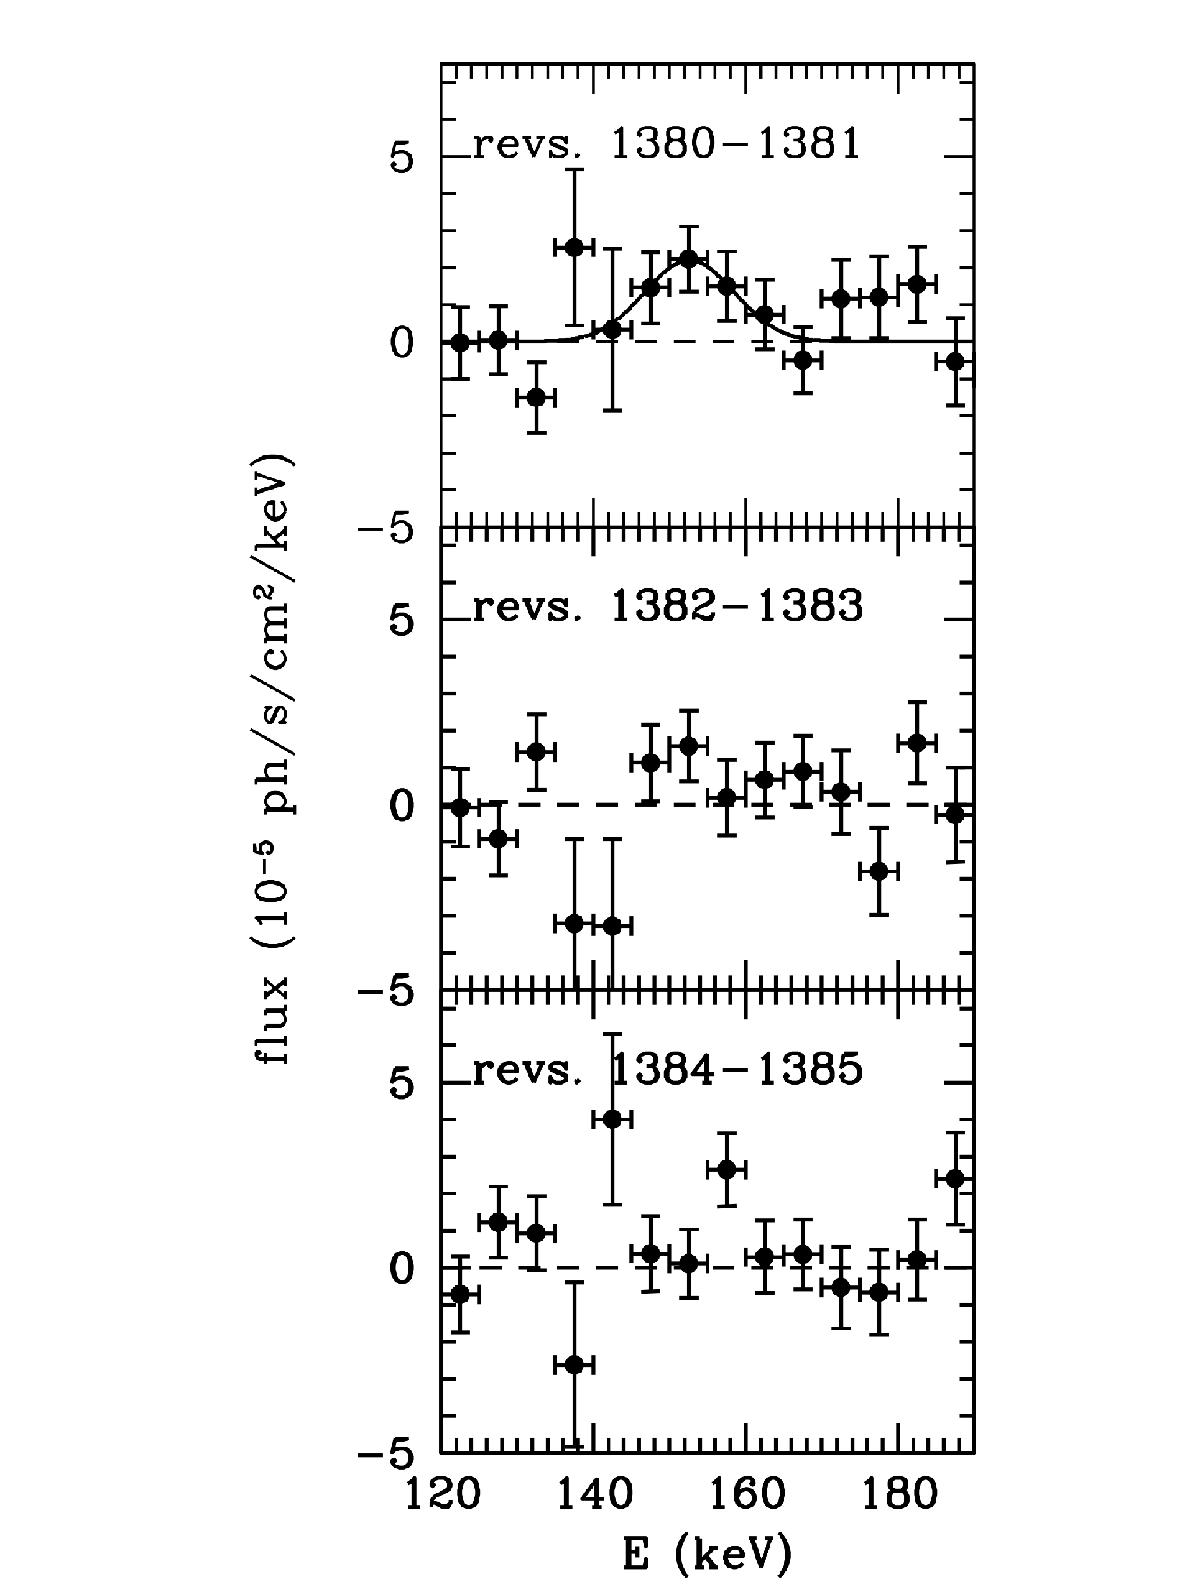
Spectral evolution of SN2014J obtained by SPI in the 120−190 keV band during revolutions 1380-81, 1382-83, and 1384-85 or 16.5−22.2, 22.6−28.2, and 28.6−35.2 days after the explosion (top to down), respectively, extracted in bins of 5 keV.
Current usage metrics show cumulative count of Article Views (full-text article views including HTML views, PDF and ePub downloads, according to the available data) and Abstracts Views on Vision4Press platform.
Data correspond to usage on the plateform after 2015. The current usage metrics is available 48-96 hours after online publication and is updated daily on week days.
Initial download of the metrics may take a while.