Free Access
Fig. 6
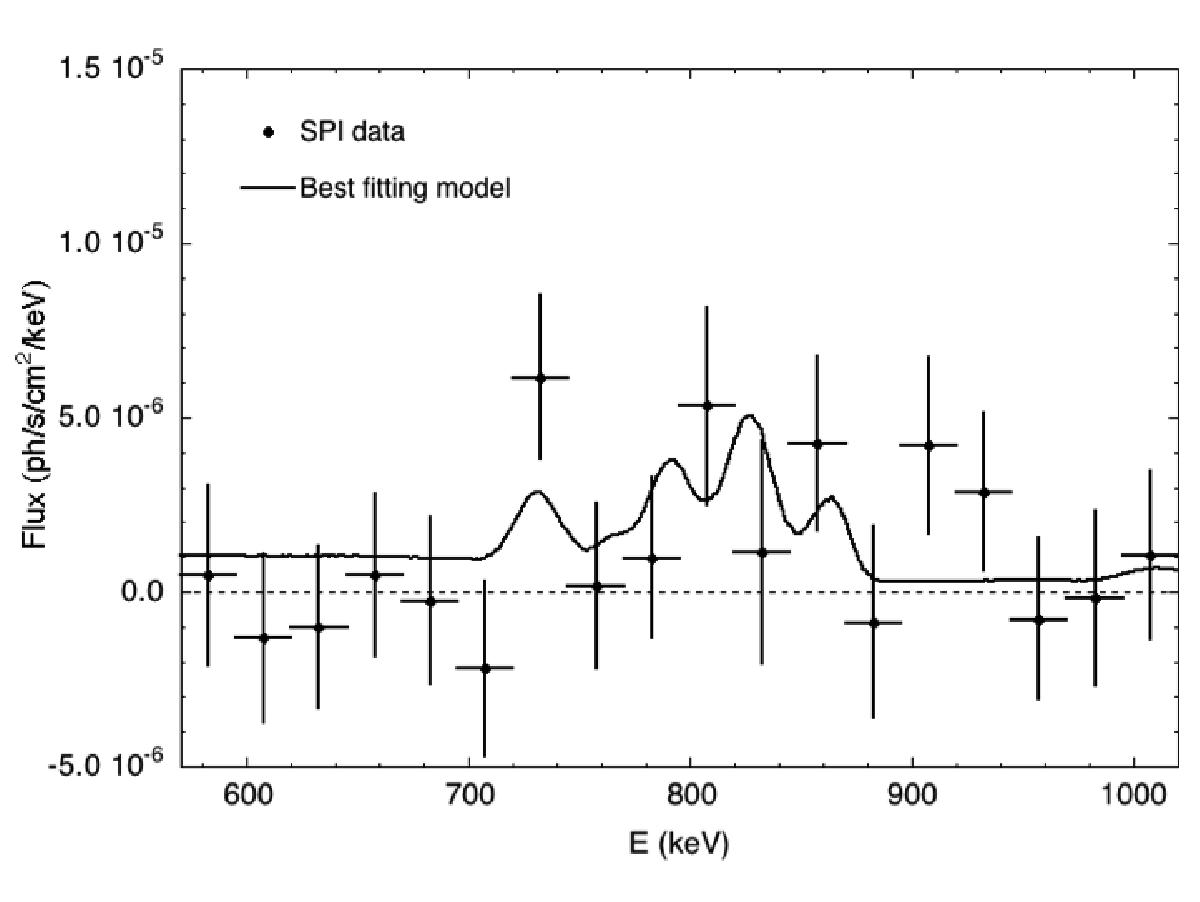
Gamma-ray spectrum during revolutions 1380-1386 (16.5−35.2 days after the explosion) but with bins of 25 keV size. As in Fig. 5, the continuous line represents the best fitting model convolved with the SPI response.
Current usage metrics show cumulative count of Article Views (full-text article views including HTML views, PDF and ePub downloads, according to the available data) and Abstracts Views on Vision4Press platform.
Data correspond to usage on the plateform after 2015. The current usage metrics is available 48-96 hours after online publication and is updated daily on week days.
Initial download of the metrics may take a while.