Fig. 4
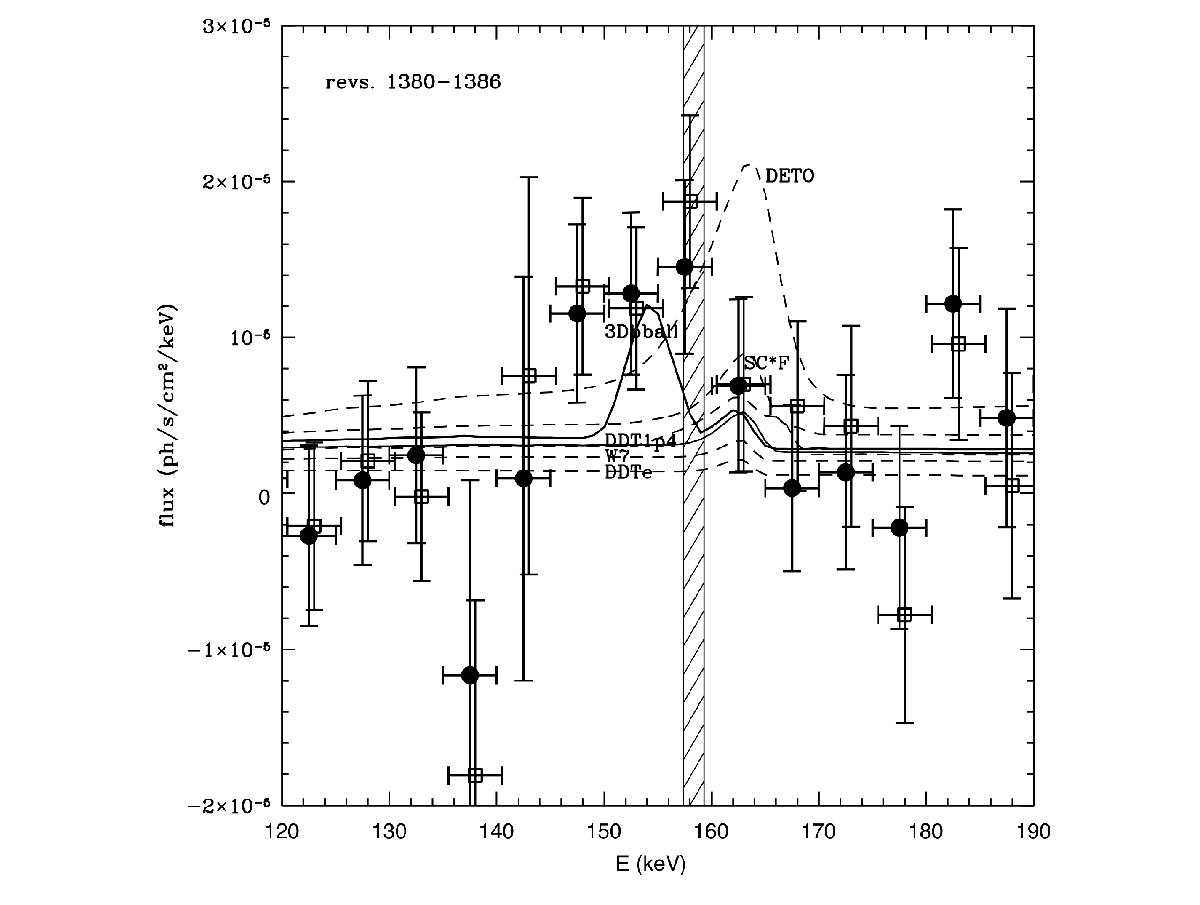
Spectrum of SN2014J obtained by SPI during revolutions 1380-1386 in bins of 5 keV in the 120−190 keV band. Filled circles were obtained with the procedures described in Isern et al. (2013) and empty squares as in Churazov et al. (2014b). The last ones have been shifted 0.5 keV for clarity. The lines represent the signal that is expected from a subset of theoretical models listed in Table A.1 (SC*F means SC1F and SC3F) after convolving with the SPI response. The shaded region is centred on the nominal energy of the 56Ni line, 158.4 keV, and its width is equal to the energy resolution of SPI at this energy.
Current usage metrics show cumulative count of Article Views (full-text article views including HTML views, PDF and ePub downloads, according to the available data) and Abstracts Views on Vision4Press platform.
Data correspond to usage on the plateform after 2015. The current usage metrics is available 48-96 hours after online publication and is updated daily on week days.
Initial download of the metrics may take a while.