Fig. 3
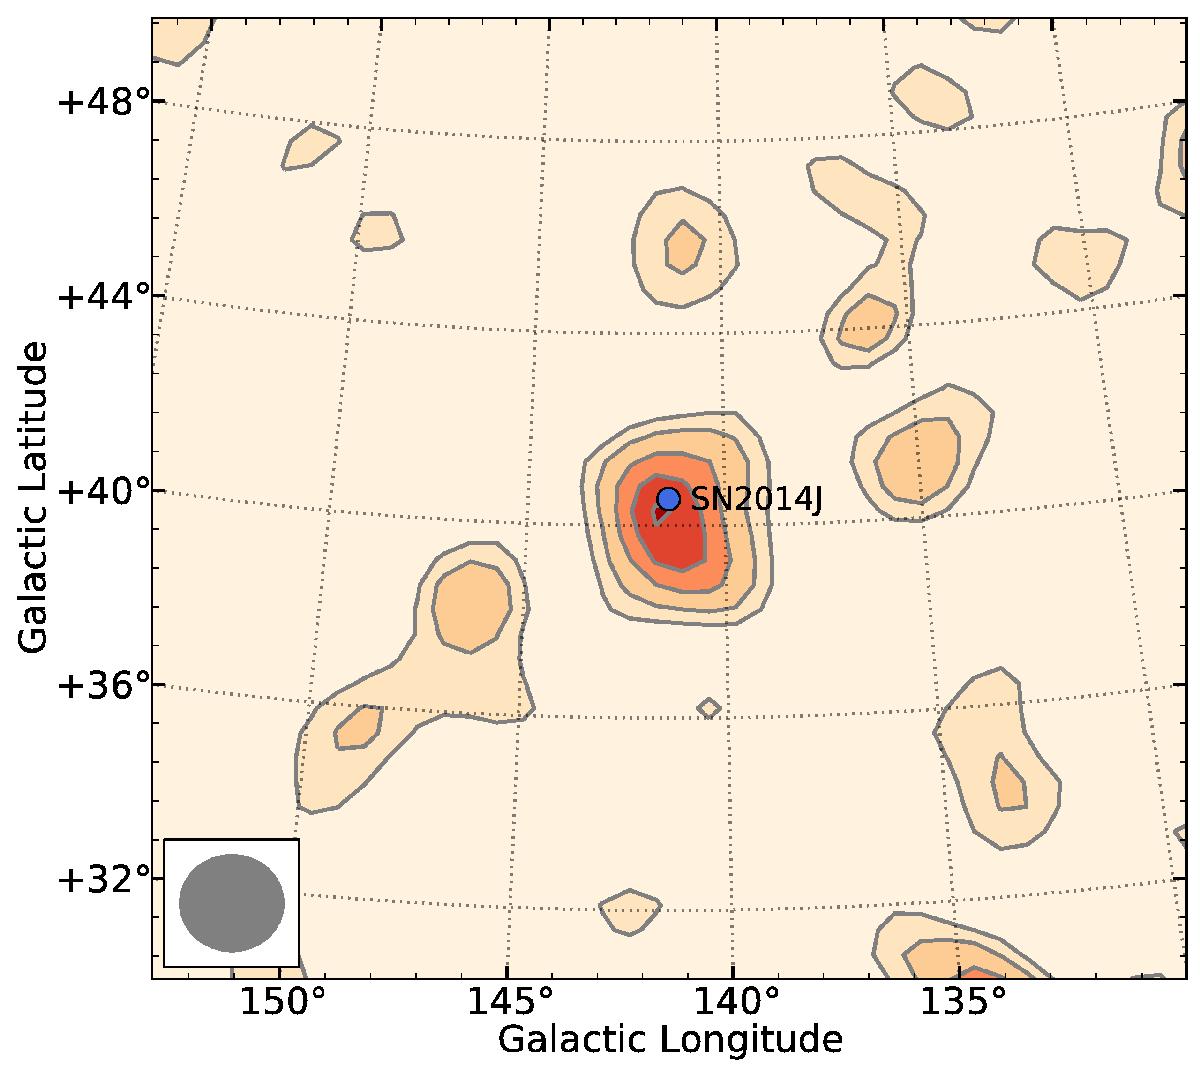
Gamma-ray signature of SN2014J in the SPI data. The panel displays the statistics map for single detector events (SE) obtained by SPI during the entire early period of observation (days ~16−35 days after the explosion) over the energy band 145−165 keV. The maximum likelihood ratio of the contour lines is 0, 2.5, 5, 10, 15, and 20. This statistics map has been obtained by fitting a point source on top of the background and the background alone for each position using pixels of 0.5 degrees. The excess in the SN2014J position is 5σ.
Current usage metrics show cumulative count of Article Views (full-text article views including HTML views, PDF and ePub downloads, according to the available data) and Abstracts Views on Vision4Press platform.
Data correspond to usage on the plateform after 2015. The current usage metrics is available 48-96 hours after online publication and is updated daily on week days.
Initial download of the metrics may take a while.