Fig. 13
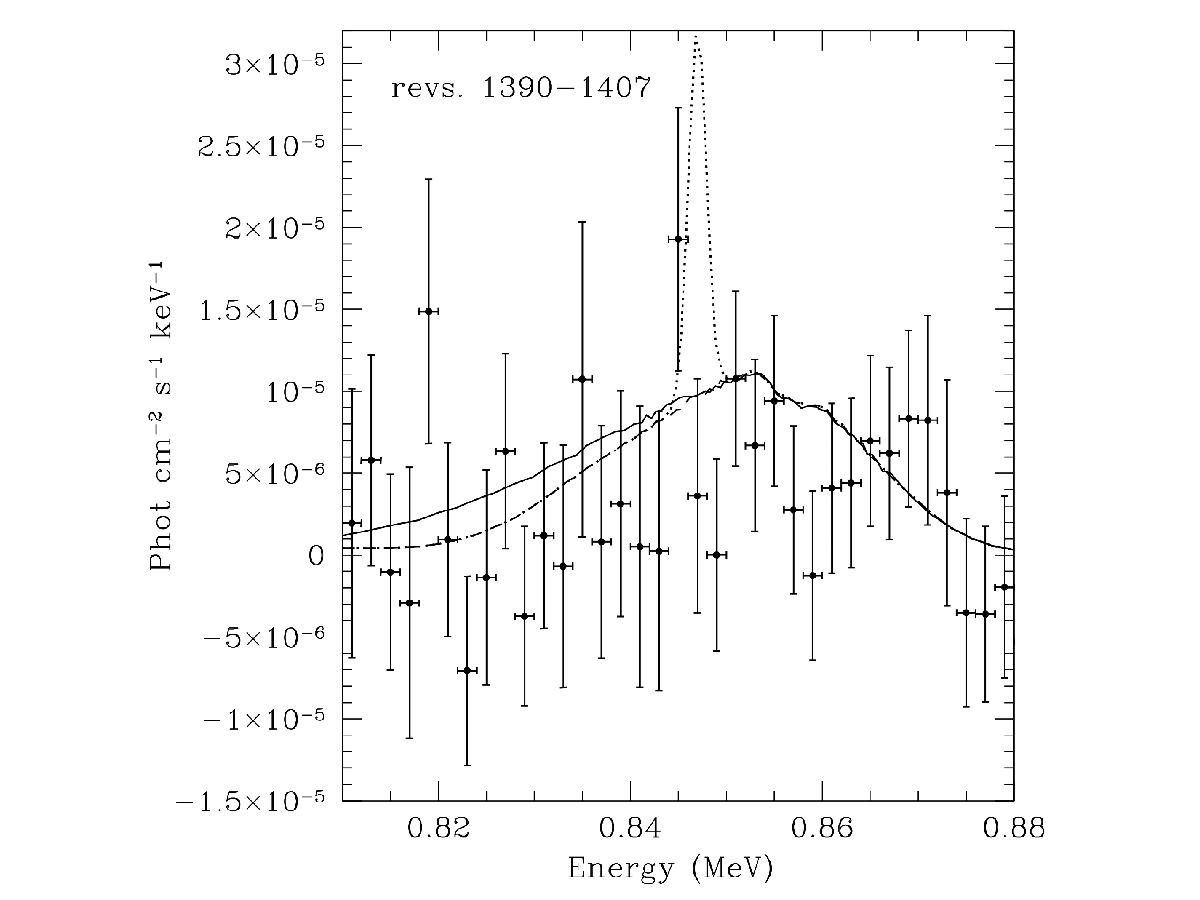
High resolution gamma-ray spectrum 50−100 days after the explosion around the 847 keV 56Co line. Bins are 2 keV wide. The dashed line represents the DDT1p4 model. The solid line represents the emission of the 3Dbball model (the DDT1p4 plus a plume of 0.07 M⊙ of 56Ni out the equatorial plane). The dotted line represents the DDT1p4 model plus a plume of 0.06 M⊙ of 56Ni confined within the equatorial plane. All of them have been computed seventy five days after the explosion.
Current usage metrics show cumulative count of Article Views (full-text article views including HTML views, PDF and ePub downloads, according to the available data) and Abstracts Views on Vision4Press platform.
Data correspond to usage on the plateform after 2015. The current usage metrics is available 48-96 hours after online publication and is updated daily on week days.
Initial download of the metrics may take a while.