Fig. 11
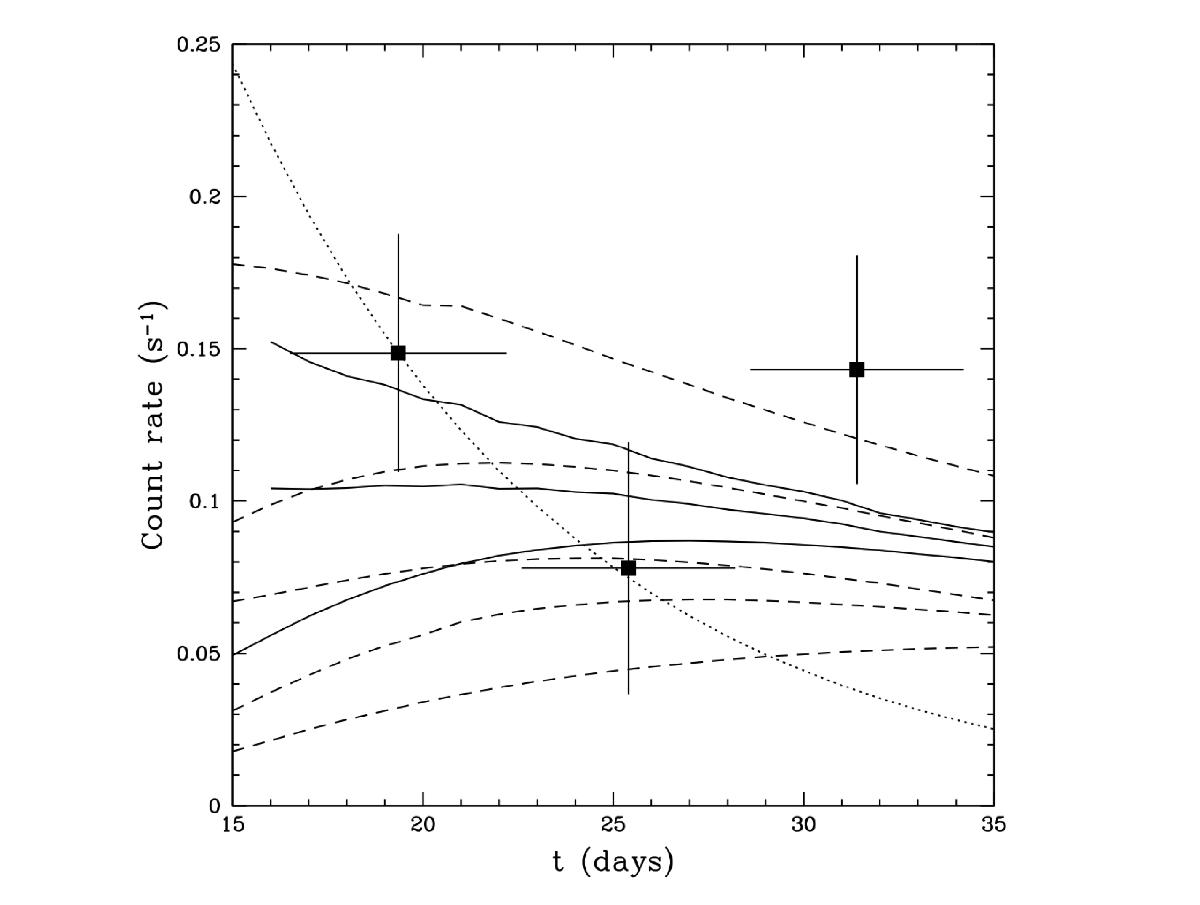
Evolution of the 67.5−189 keV band during revolutions 1380-81, 1382-83, and 1384-86 as obtained by IBIS/ISGRI using the method described in Isern et al. (2013). The dotted line represents the flux that would be provided by the free disintegration of 56Ni. Dashed lines represent the light curves obtained by convolving models DETO, SC3F, SC1F, W7, and DDTe (from top to down) with the instrument response. Solid lines represent, from top to down, the 3Dbball with plumes of 0.08 and 0.04 M⊙ of 56Ni, and the DDT1p4 models after convolution. The properties of these models are displayed in Appendix A.1.
Current usage metrics show cumulative count of Article Views (full-text article views including HTML views, PDF and ePub downloads, according to the available data) and Abstracts Views on Vision4Press platform.
Data correspond to usage on the plateform after 2015. The current usage metrics is available 48-96 hours after online publication and is updated daily on week days.
Initial download of the metrics may take a while.