Fig. 10
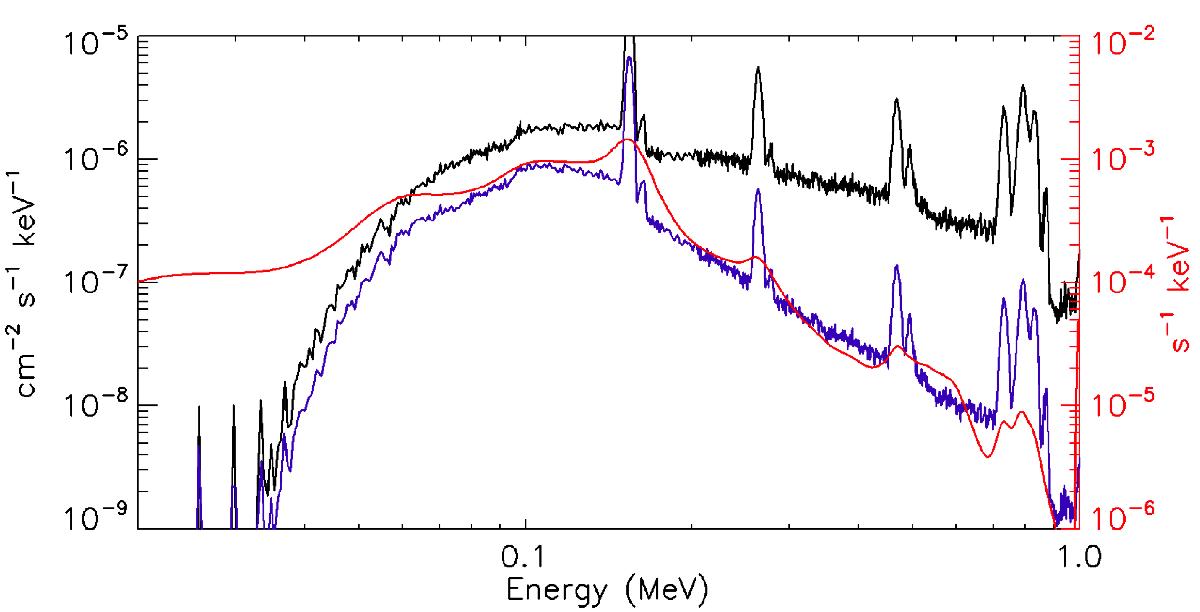
Response of IBIS/ISGRI to an incoming gamma signal that has a characteristic supernova spectrum like the one provided by the 3Dbball model (black line). The blue line is obtained by multiplying this spectrum by the ARF (auxiliary response files) that represent the effective area, and finally the red line represents the values obtained by convolving this last result with the RMF (redistribution matrix function).
Current usage metrics show cumulative count of Article Views (full-text article views including HTML views, PDF and ePub downloads, according to the available data) and Abstracts Views on Vision4Press platform.
Data correspond to usage on the plateform after 2015. The current usage metrics is available 48-96 hours after online publication and is updated daily on week days.
Initial download of the metrics may take a while.