Fig. 7
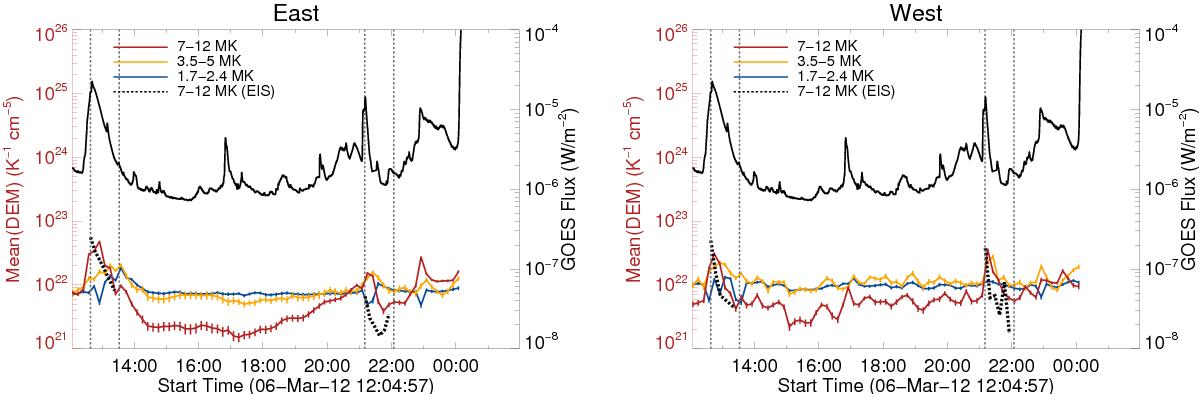
AIA mean DEM timeseries in three temperature ranges 1.7−2.4 MK (solid blue), 3.5−5 MK (solid orange) and 7−12 MK (solid red) for the a) east and b) west regions. Black dashed lines indicate the mean DEM from EIS data in the 7−12 MK temperature range. The black solid lines show the GOES flux in the 1−8 Å channel. The vertical lines show the two time periods of the EIS rasters.
Current usage metrics show cumulative count of Article Views (full-text article views including HTML views, PDF and ePub downloads, according to the available data) and Abstracts Views on Vision4Press platform.
Data correspond to usage on the plateform after 2015. The current usage metrics is available 48-96 hours after online publication and is updated daily on week days.
Initial download of the metrics may take a while.