Fig. 5
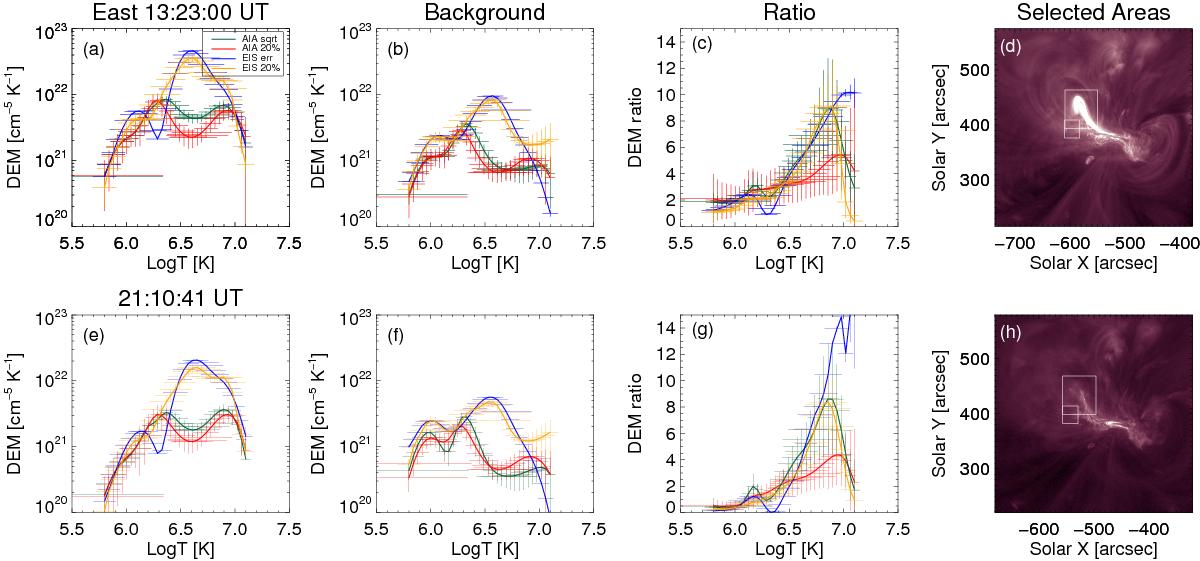
EIS and AIA DEMs calculated at two different times. First row is from the 13:23−13:31 UT EIS raster. Second row is from the 21:10−21:19 UT raster. The intensities used for the DEMs are average values in the east region (big box in panels d) and h)) and in the background (small box in panels d) and h)). a), e) east region DEM for EIS (blue,orange) and AIA(green,red). b), f) Background DEM for EIS and AIA. c), g) east/background ratio. The blue and green lines use the Poisson noise as intensity error for the DEM calculation. The orange and red lines use 20% of the intensity value as intensity error. d), h) AIA 211 Å image showing the selected AR and background regions.
Current usage metrics show cumulative count of Article Views (full-text article views including HTML views, PDF and ePub downloads, according to the available data) and Abstracts Views on Vision4Press platform.
Data correspond to usage on the plateform after 2015. The current usage metrics is available 48-96 hours after online publication and is updated daily on week days.
Initial download of the metrics may take a while.