Free Access
Fig. 4
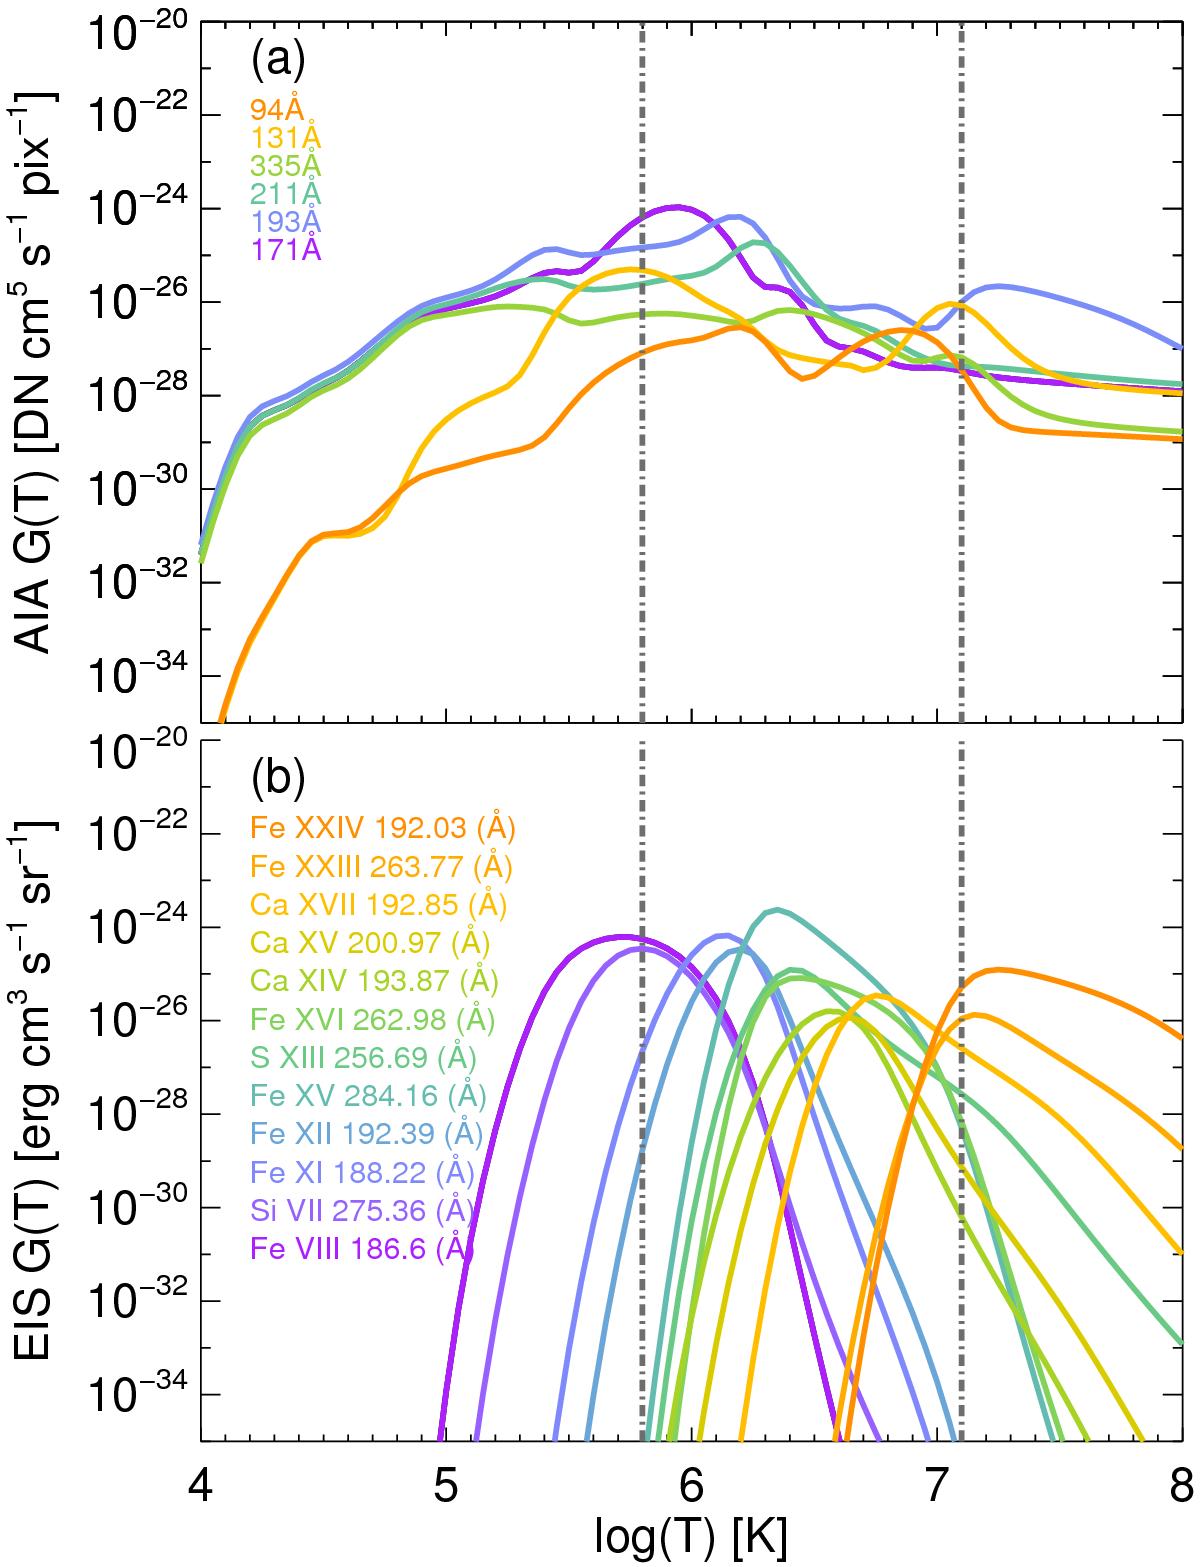
a) Response functions of AIA channels. b) Contribution functions of EIS spectral lines used in our study from CHIANTI. Grey lines indicate the temperature range used for the DEM calculations.
Current usage metrics show cumulative count of Article Views (full-text article views including HTML views, PDF and ePub downloads, according to the available data) and Abstracts Views on Vision4Press platform.
Data correspond to usage on the plateform after 2015. The current usage metrics is available 48-96 hours after online publication and is updated daily on week days.
Initial download of the metrics may take a while.