Fig. 2
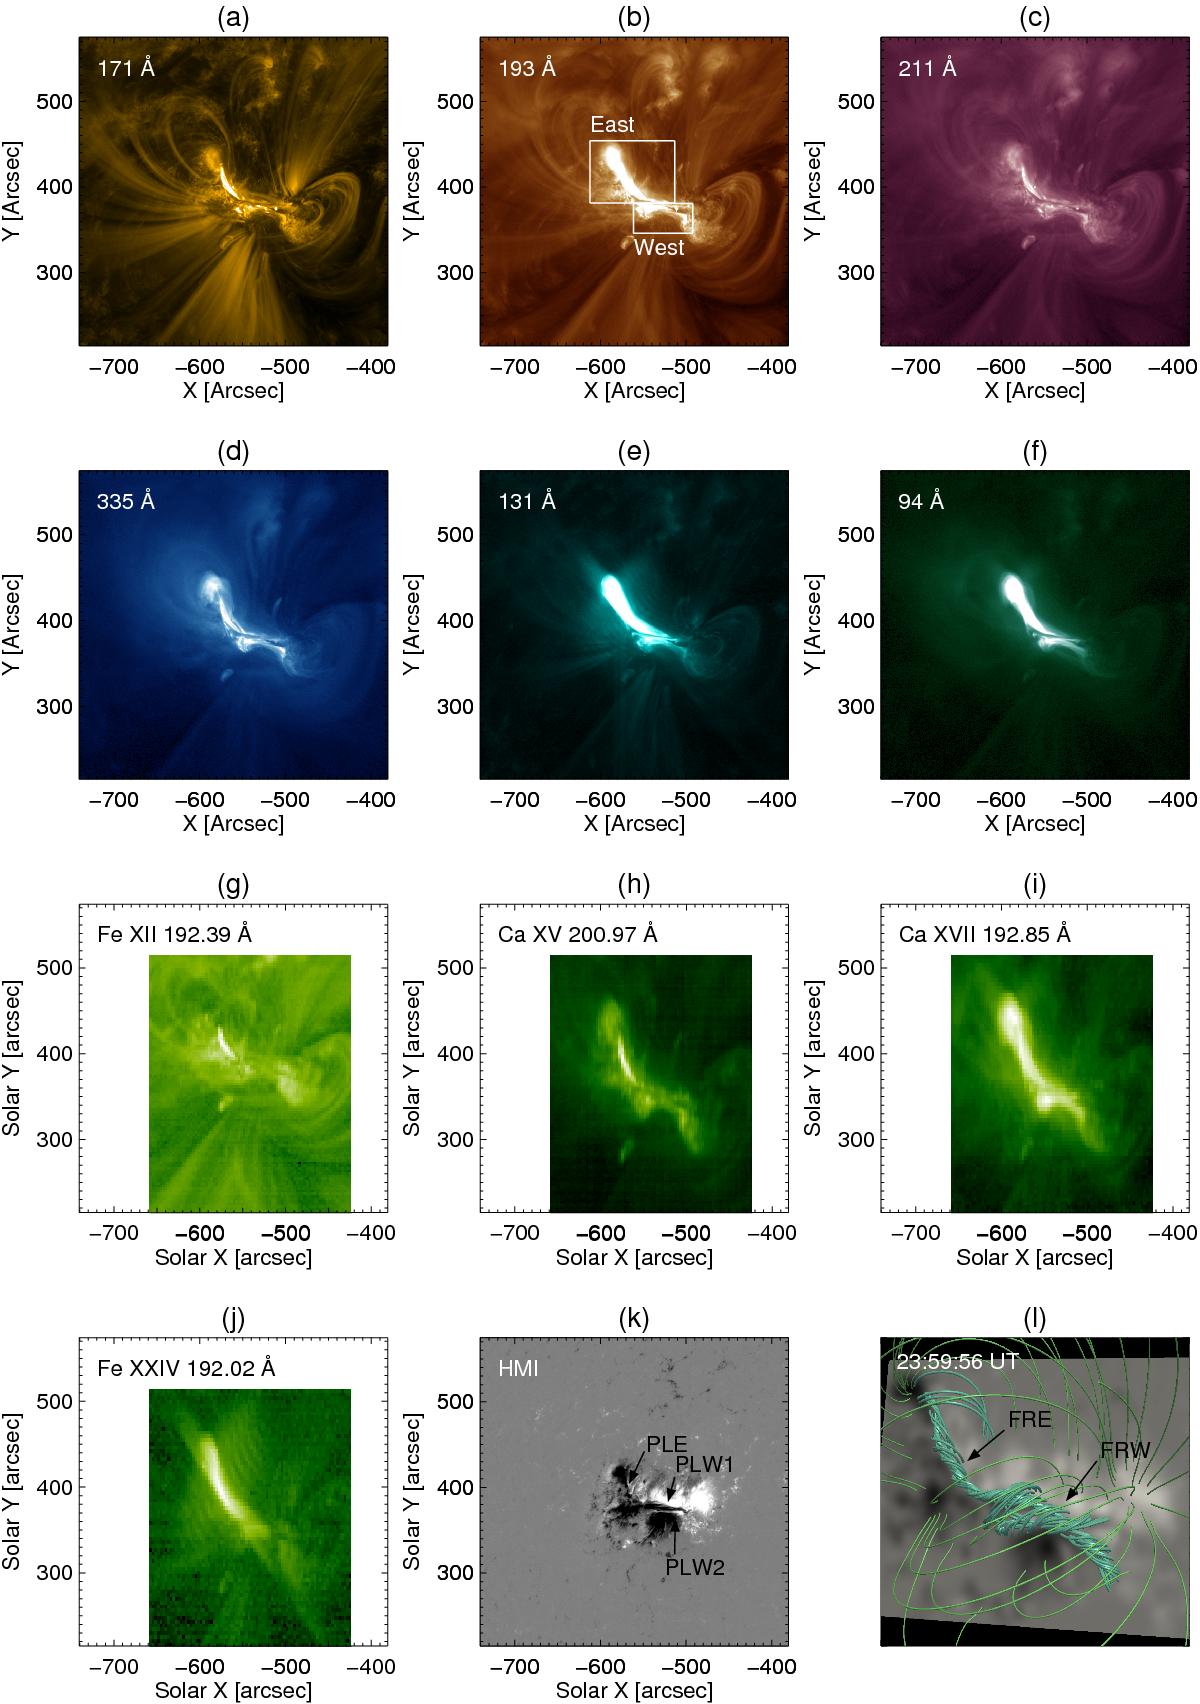
Cutouts of AIA images of the AR at March 6, 12:55 UT shown in a) 171 Å; b) 193 Å; c) 211 Å; d) 335 Å; e) 131 Å; f) 94 Å. The white boxes in b) define two sub-regions named east and west. g) EIS intensity image during the 12:47−12:56 UT raster of Fe xii 192.39 Å, h) Ca xv 200.97 Å, i) Ca xvii 192.85 Å and j) Ca xxiv 192.02 Å. Panel sizes in EIS are the same as AIA for better comparison. White spaces in panels g)−j) are due to the smaller EIS FoV (see Fig 1). k) HMI line of sight magnetogram. Arrows indicate three PILs, one in the east region (PLE) and two in the west region (PLW1, PLW2). l) Magnetic field extrapolation at March 6, 23:59 UT showing two flux rope structures, one in the east region (FRE) and one in the west region (FRW), surrounded by an envelope field. This figure is courtesy of G. Chintzoglou (see Chintzoglou et al. 2015).
Current usage metrics show cumulative count of Article Views (full-text article views including HTML views, PDF and ePub downloads, according to the available data) and Abstracts Views on Vision4Press platform.
Data correspond to usage on the plateform after 2015. The current usage metrics is available 48-96 hours after online publication and is updated daily on week days.
Initial download of the metrics may take a while.