Fig. 12
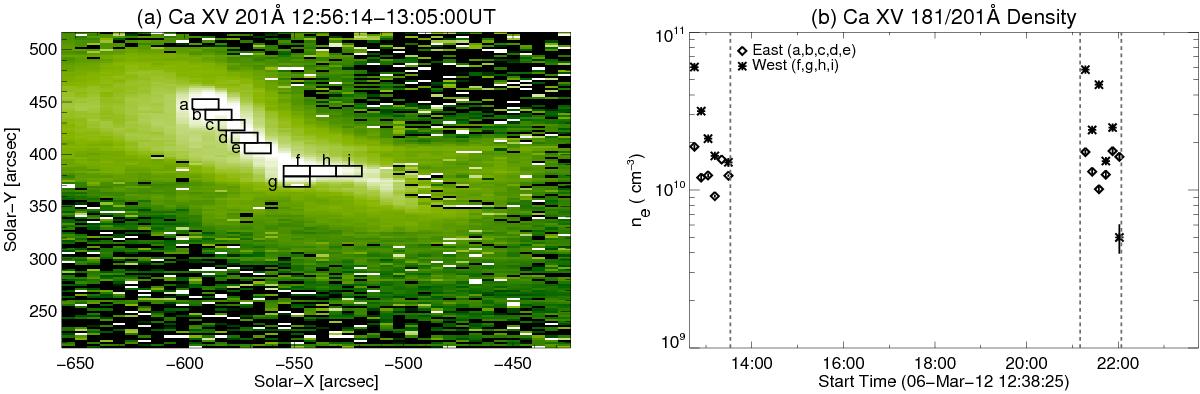
a) Intensity map of Ca xv 200.97 Å showing box selection along the east region (marked with a, b, c, d, e) and west region (marked with f, g, h, i). b) Electron density measured from the ratio of Ca xv 181.90 Å over Ca xv 200.97 Å. Each point represents the average density along the east region boxes (diamonds) and the west region boxes (asterisk) at a certain raster.
Current usage metrics show cumulative count of Article Views (full-text article views including HTML views, PDF and ePub downloads, according to the available data) and Abstracts Views on Vision4Press platform.
Data correspond to usage on the plateform after 2015. The current usage metrics is available 48-96 hours after online publication and is updated daily on week days.
Initial download of the metrics may take a while.