Fig. 11
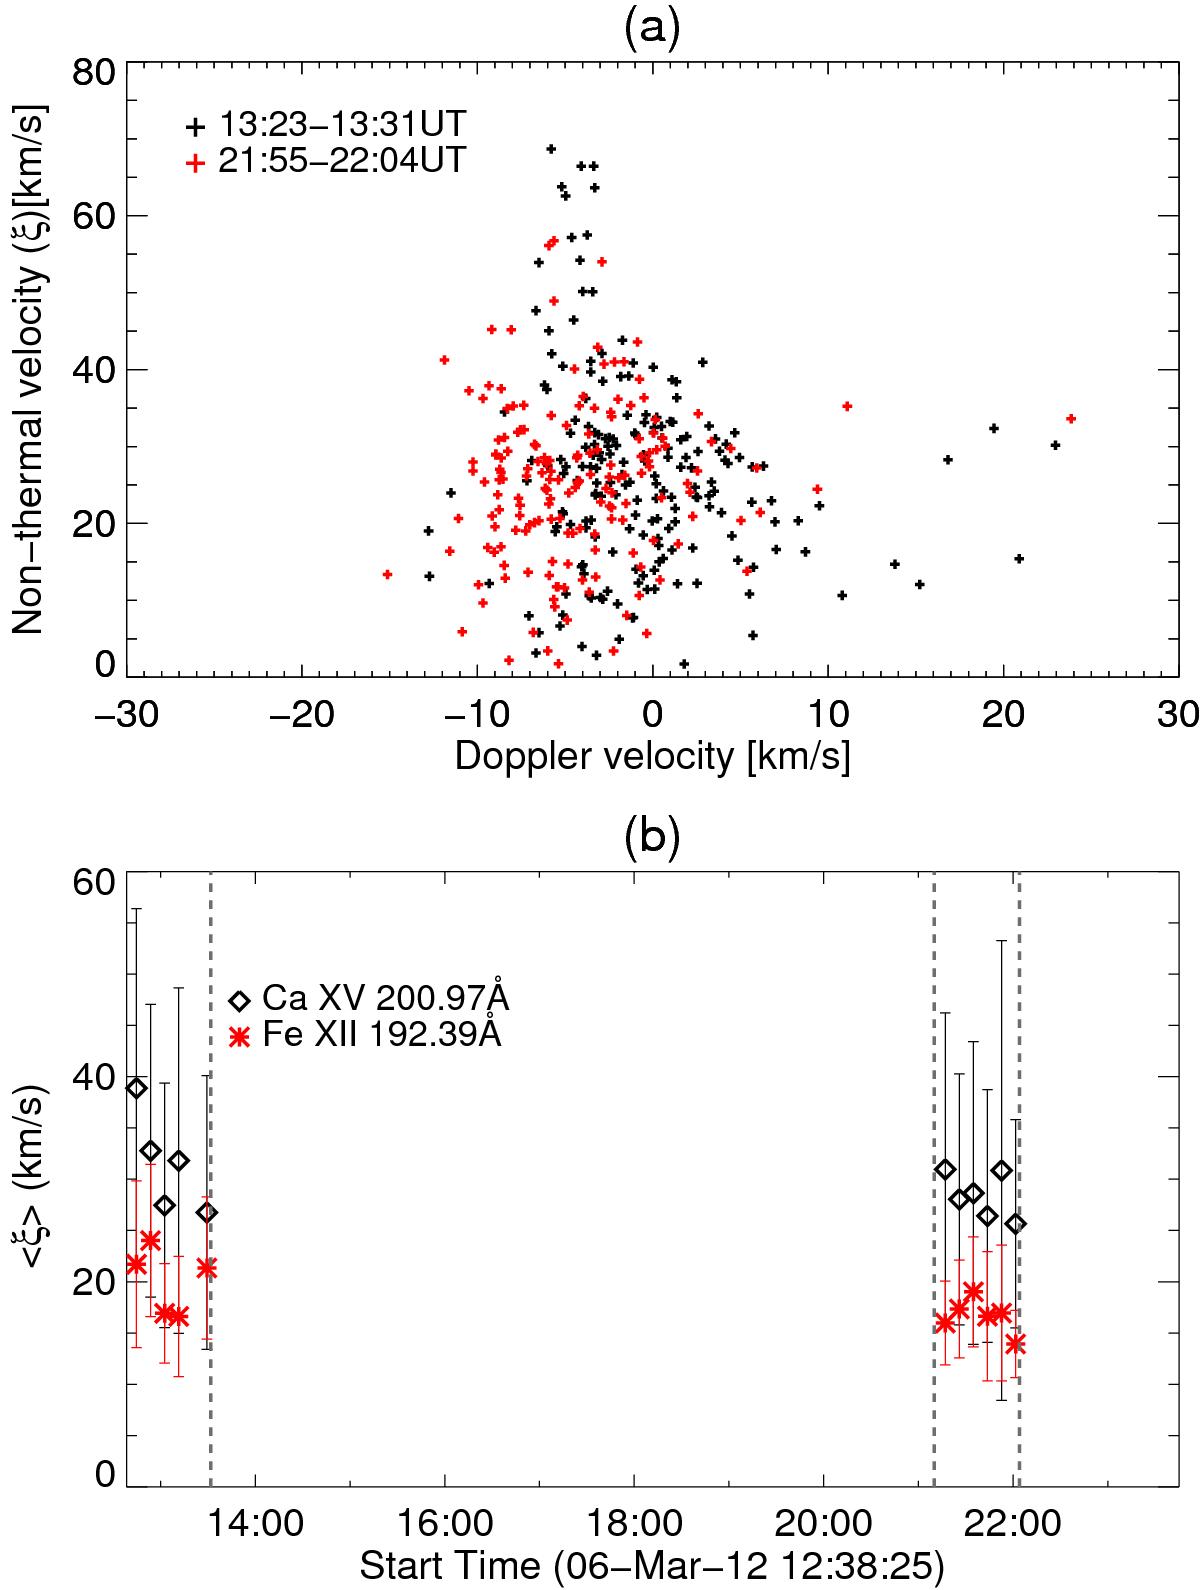
a) Non-thermal velocity in relation to Doppler flows for the Ca xv 200.97 Å spectral line, calculated at the 13:23-13:32 UT (black) and 21:56-22:04 UT (red). All the points are pixels with intensity greater than 600 erg/cm2/s/sr. b) Temporal evolution of the mean non-thermal velocity inside the contours of Fig. 10 for Ca xv 200.97 Å (black) and for Fe xii 192.39 Å (red). The error bars are the standard deviation.
Current usage metrics show cumulative count of Article Views (full-text article views including HTML views, PDF and ePub downloads, according to the available data) and Abstracts Views on Vision4Press platform.
Data correspond to usage on the plateform after 2015. The current usage metrics is available 48-96 hours after online publication and is updated daily on week days.
Initial download of the metrics may take a while.