Fig. 10
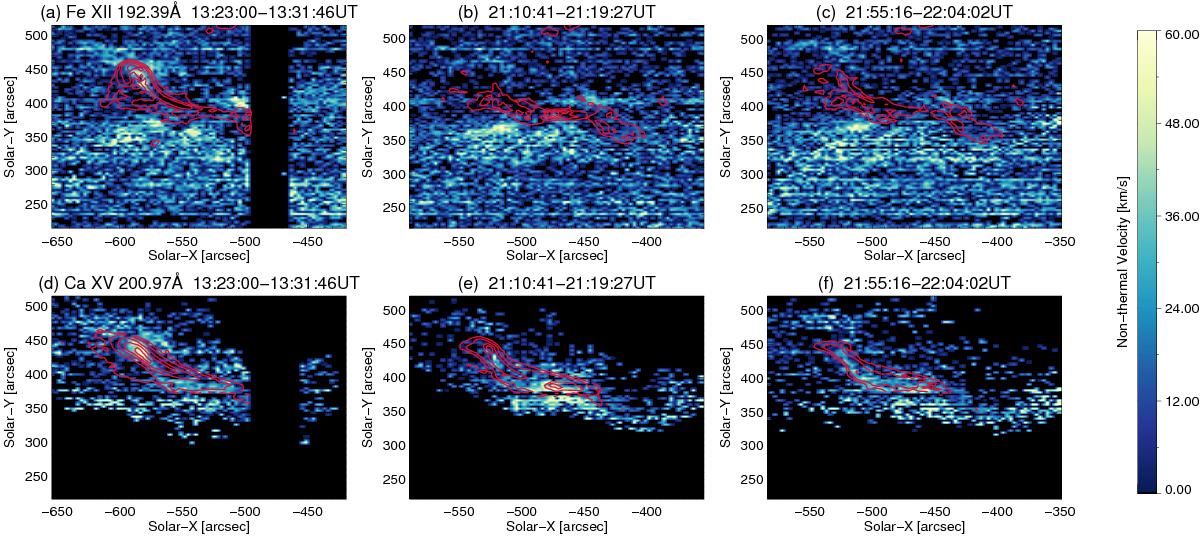
EIS non-thermal velocity maps for two lines during three rasters (columns). Black lines are intensity contours showing the position of the east and west FRs. First Row: Fe xii 192.39 Å; second Row: Ca xv 200.97 Å. Black colour indicates missing values, bad pixels, and pixels where the measured width was smaller than the instrumental.
Current usage metrics show cumulative count of Article Views (full-text article views including HTML views, PDF and ePub downloads, according to the available data) and Abstracts Views on Vision4Press platform.
Data correspond to usage on the plateform after 2015. The current usage metrics is available 48-96 hours after online publication and is updated daily on week days.
Initial download of the metrics may take a while.